client_golang 是Prometheus client的使用,基于golang语言。提供了prometheus的数据规范。
库结构
地址: https://github.com/prometheus/client_golang
Directories(描述)
api                     Package api provides clients for the HTTP APIs.
api/prometheus/v1       Package v1 provides bindings to the Prometheus HTTP API v1: http://prometheus.io/docs/querying/api/

examples/random         A simple example exposing fictional RPC latencies with different types of random distributions (uniform, normal, and exponential) as Prometheus metrics.

examples/simple         A minimal example of how to include Prometheus instrumentation.
prometheus              Package prometheus is the core instrumentation package.
prometheus/graphite     Package graphite provides a bridge to push Prometheus metrics to a Graphite server.
prometheus/promauto     Package promauto provides constructors for the usual Prometheus metrics that return them already registered with the global registry (prometheus.DefaultRegisterer).
prometheus/promhttp     Package promhttp provides tooling around HTTP servers and clients.
prometheus/push         Package push provides functions to push metrics to a Pushgateway.
上面对client_golang库的结构和使用进行了总结。
原理
原理解析
下面是客户端的UML图
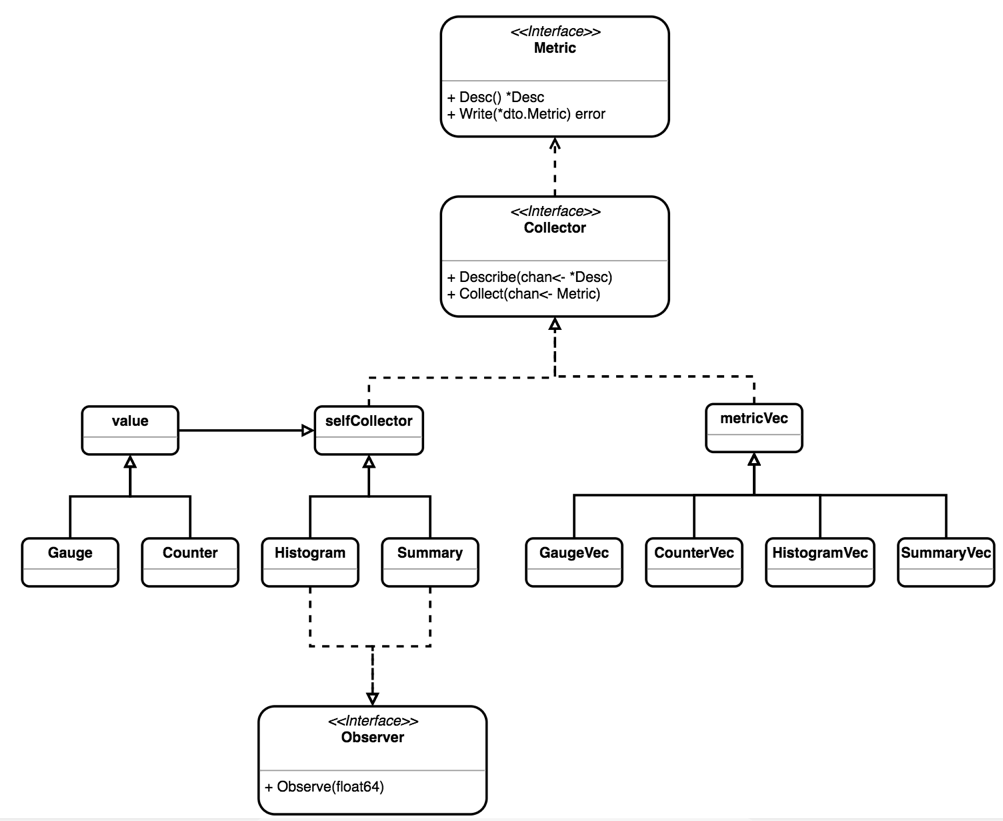
1、默认调用gocollect这个采集器,在引入package registry包的时候,就会调用init初始化
- registry会调用describe这个接口,实现就是gocollect这个对应的describe
- http.handle会调用registry的gather函数,然后函数调用collect接口,实现就是gocollect这个对应的collect
2、上面只是一种特殊类型,其实对应的四种类型分别都有对应的结构体继承vec的基本函数接口,也有对应的接口,会有对应的实现
然后这个四种类型就是就是四种collecter,同样的流程
3、可以新建一个struct作为一个collecter,实现describe,collect接口,就可以实现自己的逻辑,最后其实还是调用四种类型,结合使用
使用
1、四种类型有实现的函数赋值,常用
set()
WithLabelValues().set()
2、注册的几种方式
第一种
//statement
proxyTodayTrafficIn := prometheus.NewGaugeVec(prometheus.GaugeOpts{
    Name: "",
    Help: "The today trafficin of proxy.",
},[]string{"type","laststarttime","lastclosetime"})
//get value
proxyTodayTrafficIn.With(prometheus.Labels{"type":v.Type,"laststarttime":v.LastStartTime,"lastclosetime":v.LastCloseTime}).Set(float64(v.TodayTrafficIn))

//registry
prometheus.MustRegister(proxyTodayTrafficIn)
第二种
serverBindPort := prometheus.NewGauge(prometheus.GaugeOpts{
    Name: "frps_server_bind_port",
    Help: "The port of server frps.",
})

serverBindPort.Set(float64(cfg.BindPort))

//registry
prometheus.MustRegister(serverBindPort)
上面两种可以归为一类,都是采用的默认的方式,下面就涉及到自定义结构体,根据上面的原理,我们需要重自定义的结构体中获取到两个结构体的值
func (s *结构体) Describe(ch chan<- *prometheus.Desc) {}----可见这个接口的实现需要将prometheus.Desc放倒channel中去
func (s *结构体) Collect(ch chan<- prometheus.Metric) {}----可见这个接口的实现需要将prometheus.Metric放倒channel中去
我们来看看这两个结构体
type Desc struct {
    // fqName has been built from Namespace, Subsystem, and Name.
    fqName string
    // help provides some helpful information about this metric.
    help string
    // constLabelPairs contains precalculated DTO label pairs based on
    // the constant labels.
    constLabelPairs []*dto.LabelPair
    // VariableLabels contains names of labels for which the metric
    // maintains variable values.
    variableLabels []string
    // id is a hash of the values of the ConstLabels and fqName. This
    // must be unique among all registered descriptors and can therefore be
    // used as an identifier of the descriptor.
    id uint64
    // dimHash is a hash of the label names (preset and variable) and the
    // Help string. Each Desc with the same fqName must have the same
    // dimHash.
    dimHash uint64
    // err is an error that occured during construction. It is reported on
    // registration time.
    err error
}

type Metric interface {
    // Desc returns the descriptor for the Metric. This method idempotently
    // returns the same descriptor throughout the lifetime of the
    // Metric. The returned descriptor is immutable by contract. A Metric
    // unable to describe itself must return an invalid descriptor (created
    // with NewInvalidDesc).
    Desc() *Desc
    // Write encodes the Metric into a "Metric" Protocol Buffer data
    // transmission object.
    //
    // Metric implementations must observe concurrency safety as reads of
    // this metric may occur at any time, and any blocking occurs at the
    // expense of total performance of rendering all registered
    // metrics. Ideally, Metric implementations should support concurrent
    // readers.
    //
    // While populating dto.Metric, it is the responsibility of the
    // implementation to ensure validity of the Metric protobuf (like valid
    // UTF-8 strings or syntactically valid metric and label names). It is
    // recommended to sort labels lexicographically. (Implementers may find
    // LabelPairSorter useful for that.) Callers of Write should still make
    // sure of sorting if they depend on it.
    Write(*dto.Metric) error
    // TODO(beorn7): The original rationale of passing in a pre-allocated
    // dto.Metric protobuf to save allocations has disappeared. The
    // signature of this method should be changed to "Write() (*dto.Metric,
    // error)".
}
让我看看如何获取这两种值,首先desc,每种数据类型都有一个desc函数可以直接获取,如下:
name := fmt.Sprintf("%s_%s", namespace, metricMaps.Name)

gaugeDescription := prometheus.NewGauge(
    prometheus.GaugeOpts{
        Name:      name,
        Help:      metricMaps.Description,
    },
)

ch <- gaugeDescription.Desc()
还可以直接新建
func NewDesc(fqName, help string, variableLabels []string, constLabels Labels) *Desc {}

//new desc
desc := prometheus.NewDesc(name, metricMaps.Description, constLabels, nil)
再来看看metrics这个接口,找到其相应的结构体实现
func MustNewConstMetric(desc *Desc, valueType ValueType, value float64, labelValues ...string) Metric {}

//channel
ch <- prometheus.MustNewConstMetric(desc, vtype, value, labelValue...)
第三种
新建结构体,完成上面方法的使用,就可以了,如下:
    //set var
    vtype := prometheus.CounterValue
    name := fmt.Sprintf("%s_%s", namespace, metricMaps.Name)
    log.Debugf("counter name: %s", name)

    //new desc
    desc := prometheus.NewDesc(name, metricMaps.Description, constLabels, nil)

    //deal Value
    value, err := dealValue(res[i])
    if err != nil {
        log.Errorf("parse value error: %s",err)
        break
    }
    log.Debugf("counter value: %s", value)

    //channel
    ch <- prometheus.MustNewConstMetric(desc, vtype, value, labelValue...)
3、Newregistry调用和直接调用prometheus的对应的MustRegister其实是一样的,都是默认new一个registry的结构体
4、duplicate metrics collector registration attempted—重复注册
Collector
Collector 中 Describe 和 Collect 方法都是无状态的函数,其中 Describe 暴露全部可能的 Metric 描述列表,在注册(Register)或注销(Unregister)Collector 时会调用 Describe 来获取完整的 Metric 列表,用以检测 Metric 定义的冲突,另外在 github.com/prometheus/client_golang/prometheus/promhttp 下的 Instrument Handler 中,也会通过 Describe 获取 Metric 列表,并检查 label 列表(InstrumentHandler 中只支持 code 和 method 两种自定义 label);而通过 Collect 可以获取采样数据,然后通过 HTTP 接口暴露给 Prom Server。另外,一些临时性的进程,如批处理任务,可以把数据 push 到 Push Gateway,由 Push Gateway 暴露 pull 接口,此处不赘述。
客户端对数据的收集大多是针对标准数据结构来进行的,如下:
- Counter:收集事件次数等单调递增的数据
- Gauge:收集当前的状态,可增可减,比如数据库连接数
- Histogram:收集随机正态分布数据,比如响应延迟
- Summary:收集随机正态分布数据,和 Histogram 是类似的
每种标准数据结构还对应了 Vec 结构,通过 Vec 可以简洁的定义一组相同性质的 Metric,在采集数据的时候传入一组自定义的 Label/Value 获取具体的 Metric(Counter/Gauge/Histogram/Summary),最终都会落实到基本的数据结构上,这里不再赘述。
Counter 和 Gauge
Gauge 和 Counter 基本实现上看是一个进程内共享的浮点数,基于 value 结构实现,而 Counter 和 Gauge 仅仅封装了对这个共享浮点数的各种操作和合法性检查逻辑。
看 Counter 中 Inc 函数的实现
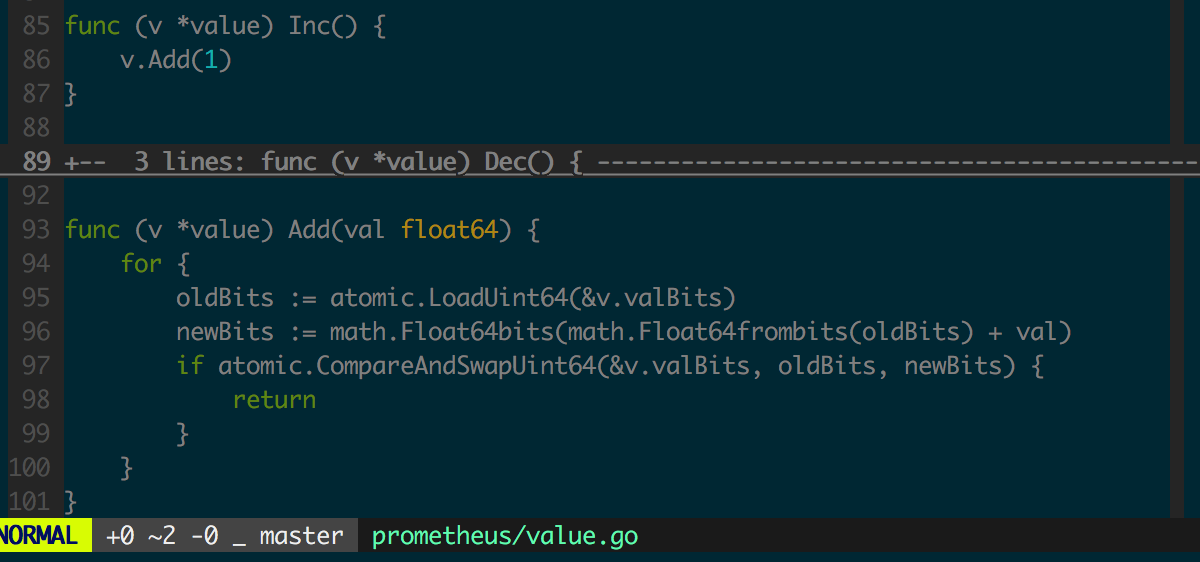
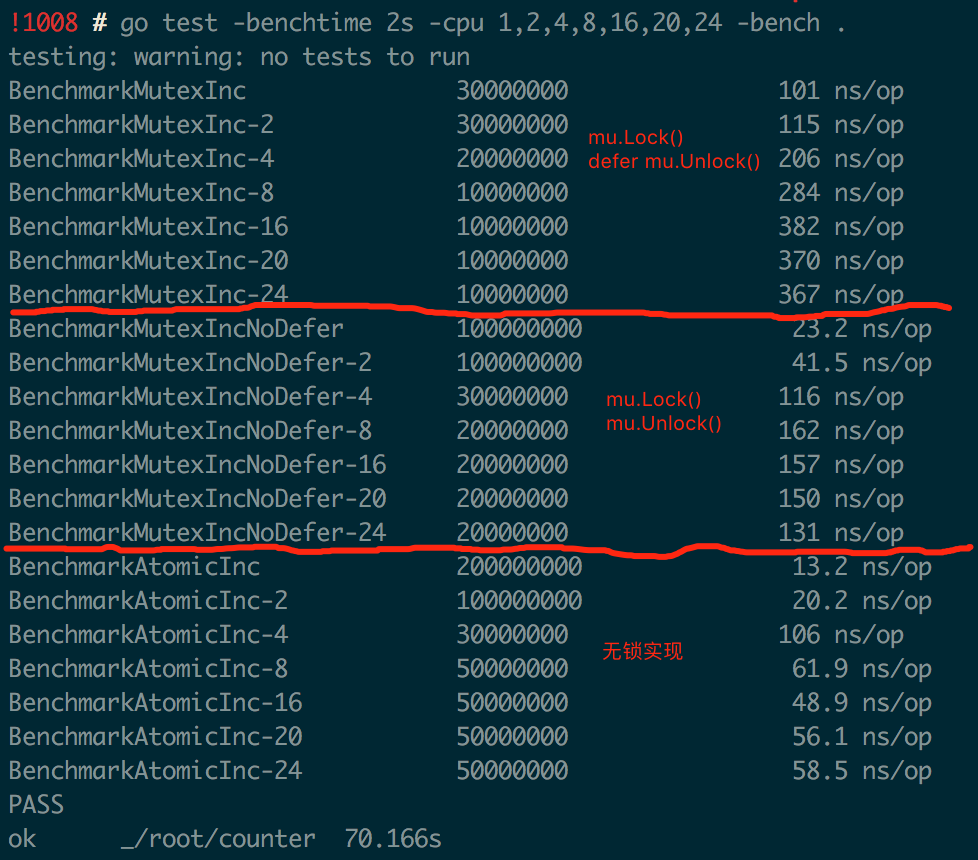
value.Add 中修改共享数据时采用了“无锁”实现,相比“有锁 (Mutex)”实现可以更充分利用多核处理器的并行计算能力,性能相比加 Mutex 的实现会有很大提升。下图是 Go Benchmark 的测试结果,对比了“有锁”(用 defer 或不用 defer 来释放锁)和“无锁”实现在多核场景下对性能的影响。
Histogram
Histogram 实现了 Observer 接口,用来获取客户端状态初始化(重启)到某个时间点的采样点分布,监控数据常需要服从正态分布。
Summary
Summary 是标准数据结构中最复杂的一个,用来收集服从正态分布的采样数据。在 Go 客户端 Summary 结构和 Histogram 一样,都实现了 Observer 接口
这两个比较复杂,使用较少,可以先不研究,使用的时候研究
集成注意事项
Go 客户端为 HTTP 层的集成提供了方便的 API,但使用中需要注意不要使用 github.com/prometheus/client_golang/prometheus 下定义的已经 deprecated 的 Instrument 函数,除了会引入额外(通常不需要)的监控数据,不仅会对程序性能造成不利影响,而且可能存在危险的 race(如计算请求大小时存在 goroutine 并发地访问 Header 逻辑)。
Prometheus Exporter实例
Exporter是基于Prometheus实施的监控系统中重要的组成部分,承担数据指标的采集工作,官方的exporter列表中已经包含了常见的绝大多数的系统指标监控,比如用于机器性能监控的node_exporter, 用于网络设备监控的snmp_exporter等等。这些已有的exporter对于监控来说,仅仅需要很少的配置工作就能提供完善的数据指标采集。
有时我们需要自己去写一些与业务逻辑比较相关的指标监控,这些指标无法通过常见的exporter获取到。比如我们需要提供对于DNS解析情况的整体监控,了解如何编写exporter对于业务监控很重要,也是完善监控系统需要经历的一个阶段。接下来我们就介绍如何编写exporter, 本篇内容编写的语言为golang, 官方也提供了python, java等其他的语言实现的库,采集方式其实大同小异。编写exporter的方式也是大同小异,就是集成对应的prometheus库,我们使用golang语言,就是集成client_golang。
下面我们就使用golang语言集成cleint_golang来开发一个exporter。
搭建环境
首先确保机器上安装了go语言(1.7版本以上),并设置好了对应的GOPATH。接下来我们就可以开始编写代码了。以下是一个简单的exporter
下载对应的prometheus包
go get github.com/prometheus/client_golang/prometheus/promhttp
程序主函数:
package main

import (
    "log"
    "net/http"
    "github.com/prometheus/client_golang/prometheus/promhttp"
)
func main() {
    http.Handle("/metrics", promhttp.Handler())
    log.Fatal(http.ListenAndServe(":8080", nil))
}
这个代码中我们仅仅通过http模块指定了一个路径,并将client_golang库中的promhttp.Handler()作为处理函数传递进去后,就可以获取指标信息了,两行代码实现了一个exporter。这里内部其实是使用了一个默认的收集器将通过NewGoCollector采集当前Go运行时的相关信息比如go堆栈使用,goroutine的数据等等。 通过访问http://localhost:8080/metrics 即可查看详细的指标参数。
上面的代码仅仅展示了一个默认的采集器,并且通过接口调用隐藏了太多实施细节,对于下一步开发并没什么作用,为了实现自定义的监控我们需要先了解一些基本概念。
指标类别
Prometheus中主要使用的四类指标类型,如下所示
- Counter (累加指标)
- Gauge (测量指标)
- Summary (概略图)
- Histogram (直方图)
这些我们在上面基本原理中已经介绍过了,这边详细的介绍,并在下面加以使用。
- Counter 一个累加指标数据,这个值随着时间只会逐渐的增加,比如程序完成的总任务数量,运行错误发生的总次数。常见的还有交换机中snmp采集的数据流量也属于该类型,代表了持续增加的数据包或者传输字节累加值。
- Gauge代表了采集的一个单一数据,这个数据可以增加也可以减少,比如CPU使用情况,内存使用量,硬盘当前的空间容量等等
- Histogram和Summary使用的频率较少,两种都是基于采样的方式。另外有一些库对于这两个指标的使用和支持程度不同,有些仅仅实现了部分功能。这两个类型对于某一些业务需求可能比较常见,比如查询单位时间内:总的响应时间低于300ms的占比,或者查询95%用户查询的门限值对应的响应时间是多少。 使用Histogram和Summary指标的时候同时会产生多组数据,_count代表了采样的总数,_sum则代表采样值的和。 _bucket则代表了落入此范围的数据。
下面是使用historam来定义的一组指标,计算出了平均五分钟内的查询请求小于0.3s的请求占比总量的比例值。
  sum(rate(http_request_duration_seconds_bucket{le="0.3"}[5m])) by (job)
/
  sum(rate(http_request_duration_seconds_count[5m])) by (job)
如果需要聚合数据,可以使用histogram. 并且如果对于分布范围有明确的值的情况下(比如300ms),也可以使用histogram。但是如果仅仅是一个百分比的值(比如上面的95%),则使用Summary
定义指标
这里我们需要引入另一个依赖库
go get github.com/prometheus/client_golang/prometheus
下面先来定义了两个指标数据,一个是Guage类型, 一个是Counter类型。分别代表了CPU温度和磁盘失败次数统计,使用上面的定义进行分类。
cpuTemp = prometheus.NewGauge(prometheus.GaugeOpts{
    Name: "cpu_temperature_celsius",
    Help: "Current temperature of the CPU.",
})
hdFailures = prometheus.NewCounterVec(
    prometheus.CounterOpts{
        Name: "hd_errors_total",
        Help: "Number of hard-disk errors.",
    },
    []string{"device"},
)
加一个counter的用法
totalScrapes: prometheus.NewCounter(prometheus.CounterOpts{
            Namespace: namespace,
            Name:      "exporter_scrapes_total",
            Help:      "Current total redis scrapes.",
        })
这里还可以注册其他的参数,比如上面的磁盘失败次数统计上,我们可以同时传递一个device设备名称进去,这样我们采集的时候就可以获得多个不同的指标。每个指标对应了一个设备的磁盘失败次数统计。
注册指标
func init() {
    // Metrics have to be registered to be exposed:
    prometheus.MustRegister(cpuTemp)
    prometheus.MustRegister(hdFailures)
}
使用prometheus.MustRegister是将数据直接注册到Default Registry,就像上面的运行的例子一样,这个Default Registry不需要额外的任何代码就可以将指标传递出去。注册后既可以在程序层面上去使用该指标了,这里我们使用之前定义的指标提供的API(Set和With().Inc)去改变指标的数据内容
func main() {
    cpuTemp.Set(65.3)
    hdFailures.With(prometheus.Labels{"device":"/dev/sda"}).Inc()

    // The Handler function provides a default handler to expose metrics
    // via an HTTP server. "/metrics" is the usual endpoint for that.
    http.Handle("/metrics", promhttp.Handler())
    log.Fatal(http.ListenAndServe(":8080", nil))
}
其中With函数是传递到之前定义的label=”device”上的值,也就是生成指标类似于
cpu_temperature_celsius 65.3
hd_errors_total{"device"="/dev/sda"} 1
当然我们写在main函数中的方式是有问题的,这样这个指标仅仅改变了一次,不会随着我们下次采集数据的时候发生任何变化,我们希望的是每次执行采集的时候,程序都去自动的抓取指标并将数据通过http的方式传递给我们。
到这里,一套基本的采集流程也就完成了,这是最基本的使用方式,当然其中也还是封装了很多过程,比如采集器等,如果需要自定义一些东西,就要了解这些封装的过程,完成重写,下面我们自定义exporter。
自定义exporter
counter数据采集实例,重写collecter
下面是一个采集Counter类型数据的实例,这个例子中实现了一个自定义的,满足采集器(Collector)接口的结构体,并手动注册该结构体后,使其每次查询的时候自动执行采集任务。
我们先来看下采集器Collector接口的实现
type Collector interface {
    // 用于传递所有可能的指标的定义描述符
    // 可以在程序运行期间添加新的描述,收集新的指标信息
    // 重复的描述符将被忽略。两个不同的Collector不要设置相同的描述符
    Describe(chan<- *Desc)

    // Prometheus的注册器调用Collect执行实际的抓取参数的工作,
    // 并将收集的数据传递到Channel中返回
    // 收集的指标信息来自于Describe中传递,可以并发的执行抓取工作,但是必须要保证线程的安全。
    Collect(chan<- Metric)
}
了解了接口的实现后,我们就可以写自己的实现了,先定义结构体,这是一个集群的指标采集器,每个集群都有自己的Zone,代表集群的名称。另外两个是保存的采集的指标。
type ClusterManager struct {
    Zone         string
    OOMCountDesc *prometheus.Desc
    RAMUsageDesc *prometheus.Desc
}
我们来实现一个采集工作,放到了ReallyExpensiveAssessmentOfTheSystemState函数中实现,每次执行的时候,返回一个按照主机名作为键采集到的数据,两个返回值分别代表了OOM错误计数,和RAM使用指标信息。
func (c *ClusterManager) ReallyExpensiveAssessmentOfTheSystemState() (
    oomCountByHost map[string]int, ramUsageByHost map[string]float64,
) {
    oomCountByHost = map[string]int{
        "foo.example.org": int(rand.Int31n(1000)),
        "bar.example.org": int(rand.Int31n(1000)),
    }
    ramUsageByHost = map[string]float64{
        "foo.example.org": rand.Float64() * 100,
        "bar.example.org": rand.Float64() * 100,
    }
    return
}
实现Describe接口,传递指标描述符到channel
// Describe simply sends the two Descs in the struct to the channel.
func (c *ClusterManager) Describe(ch chan<- *prometheus.Desc) {
    ch <- c.OOMCountDesc
    ch <- c.RAMUsageDesc
}
Collect函数将执行抓取函数并返回数据,返回的数据传递到channel中,并且传递的同时绑定原先的指标描述符。以及指标的类型(一个Counter和一个Guage)
func (c *ClusterManager) Collect(ch chan<- prometheus.Metric) {
    oomCountByHost, ramUsageByHost := c.ReallyExpensiveAssessmentOfTheSystemState()
    for host, oomCount := range oomCountByHost {
        ch <- prometheus.MustNewConstMetric(
            c.OOMCountDesc,
            prometheus.CounterValue,
            float64(oomCount),
            host,
        )
    }
    for host, ramUsage := range ramUsageByHost {
        ch <- prometheus.MustNewConstMetric(
            c.RAMUsageDesc,
            prometheus.GaugeValue,
            ramUsage,
            host,
        )
    }
}
创建结构体及对应的指标信息,NewDesc参数第一个为指标的名称,第二个为帮助信息,显示在指标的上面作为注释,第三个是定义的label名称数组,第四个是定义的Labels
func NewClusterManager(zone string) *ClusterManager {
    return &ClusterManager{
        Zone: zone,
        OOMCountDesc: prometheus.NewDesc(
            "clustermanager_oom_crashes_total",
            "Number of OOM crashes.",
            []string{"host"},
            prometheus.Labels{"zone": zone},
        ),
        RAMUsageDesc: prometheus.NewDesc(
            "clustermanager_ram_usage_bytes",
            "RAM usage as reported to the cluster manager.",
            []string{"host"},
            prometheus.Labels{"zone": zone},
        ),
    }
}
执行主程序
func main() {
    workerDB := NewClusterManager("db")
    workerCA := NewClusterManager("ca")

    // Since we are dealing with custom Collector implementations, it might
    // be a good idea to try it out with a pedantic registry.
    reg := prometheus.NewPedanticRegistry()
    reg.MustRegister(workerDB)
    reg.MustRegister(workerCA)
}
如果直接执行上面的参数的话,不会获取任何的参数,因为程序将自动推出,我们并未定义http接口去暴露数据出来,因此数据在执行的时候还需要定义一个httphandler来处理http请求。
添加下面的代码到main函数后面,即可实现数据传递到http接口上:
gatherers := prometheus.Gatherers{
    prometheus.DefaultGatherer,
    reg,
}

h := promhttp.HandlerFor(gatherers,
    promhttp.HandlerOpts{
        ErrorLog:      log.NewErrorLogger(),
        ErrorHandling: promhttp.ContinueOnError,
    })
http.HandleFunc("/metrics", func(w http.ResponseWriter, r *http.Request) {
    h.ServeHTTP(w, r)
})
log.Infoln("Start server at :8080")
if err := http.ListenAndServe(":8080", nil); err != nil {
    log.Errorf("Error occur when start server %v", err)
    os.Exit(1)
}
其中prometheus.Gatherers用来定义一个采集数据的收集器集合,可以merge多个不同的采集数据到一个结果集合,这里我们传递了缺省的DefaultGatherer,所以他在输出中也会包含go运行时指标信息。同时包含reg是我们之前生成的一个注册对象,用来自定义采集数据。
promhttp.HandlerFor()函数传递之前的Gatherers对象,并返回一个httpHandler对象,这个httpHandler对象可以调用其自身的ServHTTP函数来接手http请求,并返回响应。其中promhttp.HandlerOpts定义了采集过程中如果发生错误时,继续采集其他的数据。
尝试刷新几次浏览器获取最新的指标信息
clustermanager_oom_crashes_total{host="bar.example.org",zone="ca"} 364
clustermanager_oom_crashes_total{host="bar.example.org",zone="db"} 90
clustermanager_oom_crashes_total{host="foo.example.org",zone="ca"} 844
clustermanager_oom_crashes_total{host="foo.example.org",zone="db"} 801
# HELP clustermanager_ram_usage_bytes RAM usage as reported to the cluster manager.
# TYPE clustermanager_ram_usage_bytes gauge
clustermanager_ram_usage_bytes{host="bar.example.org",zone="ca"} 10.738111282075208
clustermanager_ram_usage_bytes{host="bar.example.org",zone="db"} 19.003276633920805
clustermanager_ram_usage_bytes{host="foo.example.org",zone="ca"} 79.72085409108028
clustermanager_ram_usage_bytes{host="foo.example.org",zone="db"} 13.041384617379178
每次刷新的时候,我们都会获得不同的数据,类似于实现了一个数值不断改变的采集器。当然,具体的指标和采集函数还需要按照需求进行修改,满足实际的业务需求。