Loki是 Grafana Labs 团队最新的开源项目,是一个水平可扩展,高可用性,多租户的日志聚合系统。它的设计非常经济高效且易于操作,因为它不会为日志内容编制索引,而是为每个日志流编制一组标签,为 Prometheus和 Kubernetes用户做了相关优化。项目受 Prometheus 启发,类似于 Prometheus 的日志系统。
基本概念
使用场景
当我们的容器云运行的应用或者某个节点出现问题了,解决思路应该如下:
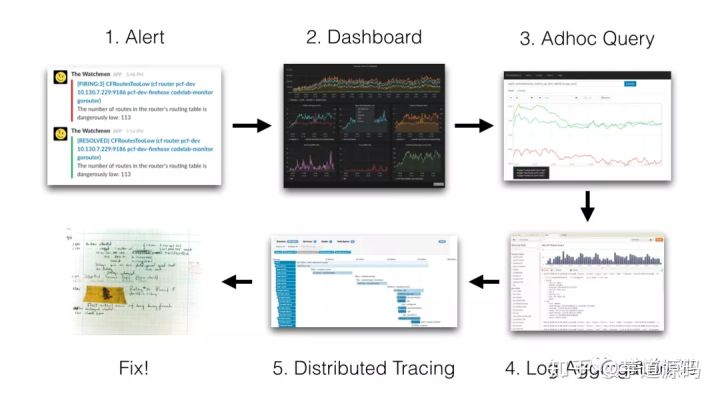
一般在容器云中使用prometheus生态来做监控告警,在metrics触发告警的时候,我们就需要查看日志来处理问题,这个时候就需要日志系统来收集日志进行搜索查看。
现有的很多日志采集的方案都是采用全文检索对日志进行索引(如ELK方案),优点是功能丰富,允许复杂的操作。但是,这些方案往往规模复杂,资源占用高,操作苦难。很多功能往往用不上,大多数查询只关注一定时间范围和一些简单的参数(如host、service等),这个时候就需要一个轻量级的日志系统,这个时候loki就比较合适了。
基本组件
Loki 整个系统需要三个组件:
1、Loki: 相当于 EFK 中的 ElasticSearch,用于存储和查询日志
2、Promtail: 相当于 EFK 中的 Filebeat/Fluentd,用于采集和发送日志
3、Grafana: 相当于 EFK 中的 Kibana,用于 UI 展示
这些组件以以下的部署在我们的系统中
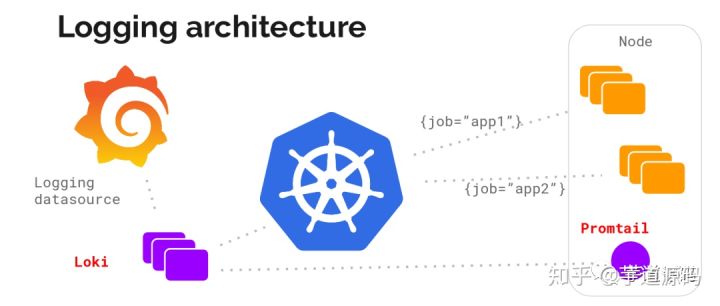
我们可以看出
1、loki: 以 Statefulset 方式部署,可横向扩容
2、promtail: 以 Daemonset 方式部署,采集每个节点上容器日志并发送给 loki
3、grafana: 默认不开启,如果集群中已经有 grafana 就可以不用在部署 grafana,如果没有,部署时可以选择也同时部署 grafana
不使用容器部署,也大体可以看出对应的部署方式,就是Promtail作为采集组件需要部署在每个一个机器上然后将数据推送到loki中,grafana在loki中拉去数据进行展示。
部署使用
k8s部署
新增helm源
$ helm repo add loki https://grafana.github.io/loki/charts
$ helm repo update
使用helm3部署
helm install loki loki/loki-stack
# 安装到指定命名空间
# helm install loki loki/loki-stack -n monitoring
# 持久化 loki 的数据,避免 loki 重启后数据丢失
# helm install loki loki/loki-stack --set="loki.persistence.enabled=ture,loki.persistence.size=100G"
# 部署 grafana
# helm install loki loki/loki-stack --set="grafana.enabled=true"
我们就可以看到对应启动了如下应用
$ kubectl get all -n monitoring | grep loki
pod/loki-0                                 1/1     Running   1          20h
pod/loki-promtail-8phlp                    1/1     Running   1          20h
service/loki                    NodePort    10.111.208.19    <none>        3100:31278/TCP               20h
service/loki-headless           ClusterIP   None             <none>        3100/TCP                     20h
daemonset.apps/loki-promtail   1         1         1       1            1           <none>                   20h
statefulset.apps/loki                1/1     20h
如上使用了以 Daemonset 方式部署了promtail,使用Statefulset 方式部署loki,然后用service暴露给grafana。
配置文件
上面启动了对应的应用,我们来看一下默认的启动情况
$ kubectl exec -ti loki-0 -n monitoring -- sh
/ $ ps -ef
PID   USER     TIME  COMMAND
    1 loki      0:01 /usr/bin/loki -config.file=/etc/loki/loki.yaml
   23 loki      0:00 sh
   28 loki      0:00 ps -ef
我们可以看到就是使用二进制文件和配置文件进行启动,所以我们关键看一下配置文件
/ $ cat /etc/loki/loki.yaml
auth_enabled: false
chunk_store_config:
  max_look_back_period: 0s
ingester:
  chunk_block_size: 262144
  chunk_idle_period: 3m
  chunk_retain_period: 1m
  lifecycler:
    ring:
      kvstore:
        store: inmemory
      replication_factor: 1
  max_transfer_retries: 0
limits_config:
  enforce_metric_name: false
  reject_old_samples: true
  reject_old_samples_max_age: 168h
schema_config:
  configs:
  - from: "2018-04-15"
    index:
      period: 168h
      prefix: index_
    object_store: filesystem
    schema: v9
    store: boltdb
server:
  http_listen_port: 3100
storage_config:
  boltdb:
    directory: /data/loki/index
  filesystem:
    directory: /data/loki/chunks
table_manager:
  retention_deletes_enabled: false
  retention_period: 0s/
我们这边详细说明一下配置文件,配置文件主要有以下几块组成
1、target:[target: <string> | default = "all"]
2、auth_enabled:[auth_enabled: <boolean> | default = true] 启动验证,默认是启动的,如果需要关闭,需要设置为false
3、server:主要是配置loki的http模块,最常见的就是配置http的地址和端口
    # HTTP server listen host
    [http_listen_address: <string>]

    # HTTP server listen port
    [http_listen_port: <int> | default = 80]

    # gRPC server listen host
    [grpc_listen_address: <string>]

    # gRPC server listen port
    [grpc_listen_port: <int> | default = 9095]

    # Register instrumentation handlers (/metrics, etc.)
    [register_instrumentation: <boolean> | default = true]

    # Timeout for graceful shutdowns
    [graceful_shutdown_timeout: <duration> | default = 30s]

    # Read timeout for HTTP server
    [http_server_read_timeout: <duration> | default = 30s]

    # Write timeout for HTTP server
    [http_server_write_timeout: <duration> | default = 30s]

    # Idle timeout for HTTP server
    [http_server_idle_timeout: <duration> | default = 120s]

    # Max gRPC message size that can be received
    [grpc_server_max_recv_msg_size: <int> | default = 4194304]

    # Max gRPC message size that can be sent
    [grpc_server_max_send_msg_size: <int> | default = 4194304]

    # Limit on the number of concurrent streams for gRPC calls (0 = unlimited)
    [grpc_server_max_concurrent_streams: <int> | default = 100]

    # Log only messages with the given severity or above. Supported values [debug,
    # info, warn, error]
    [log_level: <string> | default = "info"]

    # Base path to server all API routes from (e.g., /v1/).
    [http_path_prefix: <string>]
4、distributor主要是配置loki的分发,目前只有ring轮询
    [ring: <ring_config>]
5、ring_config主要是用来发现和连接Ingesters
    kvstore:
      # The backend storage to use for the ring. Supported values are
      # consul, etcd, inmemory
      store: <string>

      # The prefix for the keys in the store. Should end with a /.
      [prefix: <string> | default = "collectors/"]

      # Configuration for a Consul client. Only applies if store
      # is "consul"
      consul:
        # The hostname and port of Consul.
        [host: <string> | duration = "localhost:8500"]

        # The ACL Token used to interact with Consul.
        [acl_token: <string>]

        # The HTTP timeout when communicating with Consul
        [http_client_timeout: <duration> | default = 20s]

        # Whether or not consistent reads to Consul are enabled.
        [consistent_reads: <boolean> | default = true]

      # Configuration for an ETCD v3 client. Only applies if
      # store is "etcd"
      etcd:
        # The ETCD endpoints to connect to.
        endpoints:
          - <string>

        # The Dial timeout for the ETCD connection.
        [dial_timeout: <duration> | default = 10s]

        # The maximum number of retries to do for failed ops to ETCD.
        [max_retries: <int> | default = 10]

    # The heartbeat timeout after which ingesters are skipped for
    # reading and writing.
    [heartbeat_timeout: <duration> | default = 1m]

    # The number of ingesters to write to and read from. Must be at least
    # 1.
    [replication_factor: <int> | default = 3]
6、querier主要是查询配置
    # Timeout when querying ingesters or storage during the execution of a
    # query request.
    [query_timeout: <duration> | default = 1m]

    # Limit of the duration for which live tailing requests should be
    # served.
    [tail_max_duration: <duration> | default = 1h]

    # Time to wait before sending more than the minimum successful query
    # requests.
    [extra_query_delay: <duration> | default = 0s]

    # Maximum lookback beyond which queries are not sent to ingester.
    # 0 means all queries are sent to ingester.
    [query_ingesters_within: <duration> | default = 0s]

    # Configuration options for the LogQL engine.
    engine:
      # Timeout for query execution
      [timeout: <duration> | default = 3m]

      # The maximum amount of time to look back for log lines. Only
      # applicable for instant log queries.
      [max_look_back_period: <duration> | default = 30s]
7、ingester_client配置ingester的客户端,其实就是distributor连接ingester的配置
    # Configures how connections are pooled
    pool_config:
      # Whether or not to do health checks.
      [health_check_ingesters: <boolean> | default = false]

      # How frequently to clean up clients for servers that have gone away after
      # a health check.
      [client_cleanup_period: <duration> | default = 15s]

      # How quickly a dead client will be removed after it has been detected
      # to disappear. Set this to a value to allow time for a secondary
      # health check to recover the missing client.
      [remotetimeout: <duration>]

    # The remote request timeout on the client side.
    [remote_timeout: <duration> | default = 5s]

    # Configures how the gRPC connection to ingesters work as a
    # client.
    [grpc_client_config: <grpc_client_config>]
8、grpc_client_config上面的client可以使用grpc,这个时候就要对grpc进行配置
    # The maximum size in bytes the client can receive
    [max_recv_msg_size: <int> | default = 104857600]

    # The maximum size in bytes the client can send
    [max_send_msg_size: <int> | default = 16777216]

    # Whether or not messages should be compressed
    [use_gzip_compression: <bool> | default = false]

    # Rate limit for gRPC client. 0 is disabled
    [rate_limit: <float> | default = 0]

    # Rate limit burst for gRPC client.
    [rate_limit_burst: <int> | default = 0]

    # Enable backoff and retry when a rate limit is hit.
    [backoff_on_ratelimits: <bool> | default = false]

    # Configures backoff when enabled.
    backoff_config:
      # Minimum delay when backing off.
      [min_period: <duration> | default = 100ms]

      # The maximum delay when backing off.
      [max_period: <duration> | default = 10s]

      # Number of times to backoff and retry before failing.
      [max_retries: <int> | default = 10]
9、ingester_config配置Ingesters,主要是配置Ingesters的范围
    # Configures how the lifecycle of the ingester will operate
    # and where it will register for discovery.
    [lifecycler: <lifecycler_config>]

    # Number of times to try and transfer chunks when leaving before
    # falling back to flushing to the store. Zero = no transfers are done.
    [max_transfer_retries: <int> | default = 10]

    # How many flushes can happen concurrently from each stream.
    [concurrent_flushes: <int> | default = 16]

    # How often should the ingester see if there are any blocks
    # to flush
    [flush_check_period: <duration> | default = 30s]

    # The timeout before a flush is cancelled
    [flush_op_timeout: <duration> | default = 10s]

    # How long chunks should be retained in-memory after they've
    # been flushed.
    [chunk_retain_period: <duration> | default = 15m]

    # How long chunks should sit in-memory with no updates before
    # being flushed if they don't hit the max block size. This means
    # that half-empty chunks will still be flushed after a certain
    # period as long as they receive no further activity.
    [chunk_idle_period: <duration> | default = 30m]

    # The targeted _uncompressed_ size in bytes of a chunk block
    # When this threshold is exceeded the head block will be cut and compressed inside the chunk
    [chunk_block_size: <int> | default = 262144]

    # A target _compressed_ size in bytes for chunks.
    # This is a desired size not an exact size, chunks may be slightly bigger
    # or significantly smaller if they get flushed for other reasons (e.g. chunk_idle_period)
    # The default value of 0 for this will create chunks with a fixed 10 blocks,
    # A non zero value will create chunks with a variable number of blocks to meet the target size.
    [chunk_target_size: <int> | default = 0]

    # The compression algorithm to use for chunks. (supported: gzip, lz4, snappy)
    # You should choose your algorithm depending on your need:
    # - `gzip` highest compression ratio but also slowest decompression speed. (144 kB per chunk)
    # - `lz4` fastest compression speed (188 kB per chunk)
    # - `snappy` fast and popular compression algorithm (272 kB per chunk)
    [chunk_encoding: <string> | default = gzip]

    # Parameters used to synchronize ingesters to cut chunks at the same moment.
    # Sync period is used to roll over incoming entry to a new chunk. If chunk's utilization
    # isn't high enough (eg. less than 50% when sync_min_utilization is set to 0.5), then
    # this chunk rollover doesn't happen.
    [sync_period: <duration> | default = 0]
    [sync_min_utilization: <float> | Default = 0]

    # The maximum number of errors a stream will report to the user
    # when a push fails. 0 to make unlimited.
    [max_returned_stream_errors: <int> | default = 10]

    # The maximum duration of a timeseries chunk in memory. If a timeseries runs for longer than this the current chunk will be flushed to the store and a new chunk created.
    [max_chunk_age: <duration> | default = 1h]

    # How far in the past an ingester is allowed to query the store for data.
    # This is only useful for running multiple loki binaries with a shared ring with a `filesystem` store which is NOT shared between the binaries
    # When using any "shared" object store like S3 or GCS this value must always be left as 0
    # It is an error to configure this to a non-zero value when using any object store other than `filesystem`
    # Use a value of -1 to allow the ingester to query the store infinitely far back in time.
    [query_store_max_look_back_period: <duration> | default = 0]
10、lifecycler_config主要就是控制
    # Configures the ring the lifecycler connects to
    [ring: <ring_config>]

    # The number of tokens the lifecycler will generate and put into the ring if
    # it joined without transferring tokens from another lifecycler.
    [num_tokens: <int> | default = 128]

    # Period at which to heartbeat to the underlying ring.
    [heartbeat_period: <duration> | default = 5s]

    # How long to wait to claim tokens and chunks from another member when
    # that member is leaving. Will join automatically after the duration expires.
    [join_after: <duration> | default = 0s]

    # Minimum duration to wait before becoming ready. This is to work around race
    # conditions with ingesters exiting and updating the ring.
    [min_ready_duration: <duration> | default = 1m]

    # Name of network interfaces to read addresses from.
    interface_names:
      - [<string> ... | default = ["eth0", "en0"]]

    # Duration to sleep before exiting to ensure metrics are scraped.
    [final_sleep: <duration> | default = 30s]
11、storage_config主要是存储的配置,可以是本地file,可以是s3等远程存储。这边有很多配置就不一一看了。
12、cache_config就是将数据放到缓存中,比如memche,redis等
13、chunk_store_config是对chunk存储的设置包括多长时间进行存储等
    # The cache configuration for storing chunks
    [chunk_cache_config: <cache_config>]

    # The cache configuration for deduplicating writes
    [write_dedupe_cache_config: <cache_config>]

    # The minimum time between a chunk update and being saved
    # to the store.
    [min_chunk_age: <duration>]

    # Cache index entries older than this period. Default is
    # disabled.
    [cache_lookups_older_than: <duration>]

    # Limit how long back data can be queried. Default is disabled.
    # This should always be set to a value less than or equal to
    # what is set in `table_manager.retention_period`.
    [max_look_back_period: <duration>]
14、schema_config主要是对时间进行设置,格式是period_config
    # The configuration for chunk index schemas.
    configs:
      - [<period_config>]
    # The date of the first day that index buckets should be created. Use
    # a date in the past if this is your only period_config, otherwise
    # use a date when you want the schema to switch over.
    [from: <daytime>]

    # store and object_store below affect which <storage_config> key is
    # used.

    # Which store to use for the index. Either aws, gcp, bigtable, bigtable-hashed,
    # cassandra, or boltdb.
    store: <string>

    # Which store to use for the chunks. Either aws, aws-dynamo, azure, gcp,
    # bigtable, gcs, cassandra, swift or filesystem. If omitted, defaults to the same
    # value as store.
    [object_store: <string>]

    # The schema version to use, current recommended schema is v11.
    schema: <string>

    # Configures how the index is updated and stored.
    index:
      # Table prefix for all period tables.
      prefix: <string>
      # Table period.
      [period: <duration> | default = 168h]
      # A map to be added to all managed tables.
      tags:
        [<string>: <string> ...]

    # Configured how the chunks are updated and stored.
    chunks:
      # Table prefix for all period tables.
      prefix: <string>
      # Table period.
      [period: <duration> | default = 168h]
      # A map to be added to all managed tables.
      tags:
        [<string>: <string> ...]

    # How many shards will be created. Only used if schema is v10 or greater.
    [row_shards: <int> | default = 16]
15、limits_config
    # Whether the ingestion rate limit should be applied individually to each
    # distributor instance (local), or evenly shared across the cluster (global).
    # The ingestion rate strategy cannot be overridden on a per-tenant basis.
    #
    # - local: enforces the limit on a per distributor basis. The actual effective
    #   rate limit will be N times higher, where N is the number of distributor
    #   replicas.
    # - global: enforces the limit globally, configuring a per-distributor local
    #   rate limiter as "ingestion_rate / N", where N is the number of distributor
    #   replicas (it's automatically adjusted if the number of replicas change).
    #   The global strategy requires the distributors to form their own ring, which
    #   is used to keep track of the current number of healthy distributor replicas.
    [ingestion_rate_strategy: <string> | default = "local"]

    # Per-user ingestion rate limit in sample size per second. Units in MB.
    [ingestion_rate_mb: <float> | default = 4]

    # Per-user allowed ingestion burst size (in sample size). Units in MB.
    # The burst size refers to the per-distributor local rate limiter even in the
    # case of the "global" strategy, and should be set at least to the maximum logs
    # size expected in a single push request.
    [ingestion_burst_size_mb: <int> | default = 6]

    # Maximum length of a label name.
    [max_label_name_length: <int> | default = 1024]

    # Maximum length of a label value.
    [max_label_value_length: <int> | default = 2048]

    # Maximum number of label names per series.
    [max_label_names_per_series: <int> | default = 30]

    # Whether or not old samples will be rejected.
    [reject_old_samples: <bool> | default = false]

    # Maximum accepted sample age before rejecting.
    [reject_old_samples_max_age: <duration> | default = 336h]

    # Duration for a table to be created/deleted before/after it's
    # needed. Samples won't be accepted before this time.
    [creation_grace_period: <duration> | default = 10m]

    # Enforce every sample has a metric name.
    [enforce_metric_name: <boolean> | default = true]

    # Maximum number of active streams per user, per ingester. 0 to disable.
    [max_streams_per_user: <int> | default = 10000]

    # Maximum line size on ingestion path. Example: 256kb.
    # There is no limit when unset.
    [max_line_size: <string> | default = none ]

    # Maximum number of log entries that will be returned for a query. 0 to disable.
    [max_entries_limit: <int> | default = 5000 ]

    # Maximum number of active streams per user, across the cluster. 0 to disable.
    # When the global limit is enabled, each ingester is configured with a dynamic
    # local limit based on the replication factor and the current number of healthy
    # ingesters, and is kept updated whenever the number of ingesters change.
    [max_global_streams_per_user: <int> | default = 0]

    # Maximum number of chunks that can be fetched by a single query.
    [max_chunks_per_query: <int> | default = 2000000]

    # The limit to length of chunk store queries. 0 to disable.
    [max_query_length: <duration> | default = 0]

    # Maximum number of queries that will be scheduled in parallel by the
    # frontend.
    [max_query_parallelism: <int> | default = 14]

    # Cardinality limit for index queries
    [cardinality_limit: <int> | default = 100000]

    # Maximum number of stream matchers per query.
    [max_streams_matchers_per_query: <int> | default = 1000]

    # Feature renamed to 'runtime configuration', flag deprecated in favor of -runtime-config.file (runtime_config.file in YAML)
    [per_tenant_override_config: <string>]

    # Feature renamed to 'runtime configuration', flag deprecated in favor of -runtime-config.reload-period (runtime_config.period in YAML)
    [per_tenant_override_period: <duration> | default = 10s]
16、frontend_worker_config
    # Address of query frontend service, in host:port format.
    # CLI flag: -querier.frontend-address
    [frontend_address: <string> | default = ""]

    # Number of simultaneous queries to process.
    # CLI flag: -querier.worker-parallelism
    [parallelism: <int> | default = 10]

    # How often to query DNS.
    # CLI flag: -querier.dns-lookup-period
    [dns_lookup_duration: <duration> | default = 10s]

    grpc_client_config:
      # gRPC client max receive message size (bytes).
      # CLI flag: -querier.frontend-client.grpc-max-recv-msg-size
      [max_recv_msg_size: <int> | default = 104857600]

      # gRPC client max send message size (bytes).
      # CLI flag: -querier.frontend-client.grpc-max-send-msg-size
      [max_send_msg_size: <int> | default = 16777216]

      # Use compression when sending messages.
      # CLI flag: -querier.frontend-client.grpc-use-gzip-compression
      [use_gzip_compression: <boolean> | default = false]

      # Rate limit for gRPC client; 0 means disabled.
      # CLI flag: -querier.frontend-client.grpc-client-rate-limit
      [rate_limit: <float> | default = 0]

      # Rate limit burst for gRPC client.
      # CLI flag: -querier.frontend-client.grpc-client-rate-limit-burst
      [rate_limit_burst: <int> | default = 0]

      # Enable backoff and retry when we hit ratelimits.
      # CLI flag: -querier.frontend-client.backoff-on-ratelimits
      [backoff_on_ratelimits: <boolean> | default = false]

      backoff_config:
        # Minimum delay when backing off.
        # CLI flag: -querier.frontend-client.backoff-min-period
        [min_period: <duration> | default = 100ms]

        # Maximum delay when backing off.
        # CLI flag: -querier.frontend-client.backoff-max-period
        [max_period: <duration> | default = 10s]

        # Number of times to backoff and retry before failing.
        # CLI flag: -querier.frontend-client.backoff-retries
        [max_retries: <int> | default = 10]
17、table_manager_config,provision_config都是用于DynamoDB。
18、auto_scaling_config用于DynamoDB的自动伸缩
具体可以参考官网。
loki的配置还是比较复杂的,下面我们再来看一下promtail的配置
# cat promtail.yaml
client:
  backoff_config:
    max_period: 5s
    max_retries: 20
    min_period: 100ms
  batchsize: 102400
  batchwait: 1s
  external_labels: {}
  timeout: 10s
positions:
  filename: /run/promtail/positions.yaml
server:
  http_listen_port: 3101
target_config:
  sync_period: 10s
scrape_configs:
- job_name: kubernetes-pods-name
  pipeline_stages:
    - docker: {}
  kubernetes_sd_configs:
  - role: pod
  relabel_configs:
  - source_labels:
    - __meta_kubernetes_pod_label_name
    target_label: __service__
  - source_labels:
    - __meta_kubernetes_pod_node_name
    target_label: __host__
  - action: drop
    regex: ''
    source_labels:
    - __service__
  - action: labelmap
    regex: __meta_kubernetes_pod_label_(.+)
  - action: replace
    replacement: $1
    separator: /
    source_labels:
    - __meta_kubernetes_namespace
    - __service__
    target_label: job
  - action: replace
    source_labels:
    - __meta_kubernetes_namespace
    target_label: namespace
  - action: replace
    source_labels:
    - __meta_kubernetes_pod_name
    target_label: pod
  - action: replace
    source_labels:
    - __meta_kubernetes_pod_container_name
    target_label: container
  - replacement: /var/log/pods/*$1/*.log
    separator: /
    source_labels:
    - __meta_kubernetes_pod_uid
    - __meta_kubernetes_pod_container_name
    target_label: __path__
- job_name: kubernetes-pods-app
......
promtail的配置和prometheus很像,我们也简单说明一下,promtail的复杂配置分为四个部分。
server_config 配置promtail作为一个服务器。开启一个http端口
client_config 配置promtail怎么连接loki,它作为loki的客户端
position_config 指明promtail的配置文件在什么地方生成,重启的时候会读取一些信息
scrape_config 配置一些常用的抓取策略
我们主要配置的地方,就是scrape_config 。它又分为几种常见的抓取方式,比如
journal_config
syslog_config
relabel_config
static_config
file_sd_config
kubernetes_sd_config
对于我们来说,最常使用的就是static_config,比如指定业务的某个日志文件。这部分的描述很长,具体可以参考github文档。
一个配置文件中,是可以针对不同类型的日志文件同时进行监控的。比如下面的长长的配置文件,就加入了三个抓取策略。
server:
  http_listen_port: 9080
  grpc_listen_port: 0

positions:
  filename: /tmp/positions.yaml

clients:
  - url: http://localhost:3100/loki/api/v1/push

scrape_configs:
  - job_name: journal
    journal:
      max_age: 12h
      labels:
        job: systemd-journal
    relabel_configs:
      - source_labels: ['__journal__systemd_unit']
        target_label: 'unit'
  - job_name: system
    pipeline_stages:
    static_configs:
    - labels:
       job: varlogs
       host: yourhost
       __path__: /var/log/*.log
  - job_name: biz001
    pipeline_stages:
    - match:
       selector: '{app="test"}'
       stages:
       - regex:
          expression: '.*level=(?P<level>[a-zA-Z]+).*ts=(?P<timestamp>[T\d-:.Z]*).*component=(?P<component>[a-zA-Z]+)'
       - labels:
          level:
          component:
          ts:
          timestrap:
    static_configs:
    - labels:
       job: biz001
       app: test
       node: 001
       host: localhost
       __path__: /alertmgr/dingtalk/nohup.out
我们配置了三个job(概念见普罗米修斯),journal,system和biz001。尤其注意biz001的配置,这代表了我们对一些日志的通用配置方式。
首先,看一下biz001的日志格式。
level=info ts=2020-04-30T01:20:38.631Z caller=entry.go:22 component=web http_scheme=http http_proto=HTTP/1.1 http_method=POST remote_addr=[::1]:57710 user_agent=Alertmanager/0.20.0 uri=http://localhost:8060/dingtalk/webhook1/send resp_status=200 resp_bytes_length=2 resp_elapsed_ms=5207.398549 msg="request complete"
在将日志传送到Loki之前,promtail可以对其进行一系列的操作。比如过滤一些日志,提取一些label,替换一些日志的内容等。
对于这部分的操作,现有的日志收集工具都搞了一套自己的,而且都很难用。
比如我们用来解析我们固定格式的nginx日志
# ps -ef | grep promtail
root     14449 14356  0 21:06 pts/0    00:00:00 grep promtail
root     28509     1  0 Jul21 ?        00:23:12 /opt/promes/loki/promtail-linux-amd64 --config.file=/opt/promes/loki/nginx.yaml
[root@promessitweb19 ~]# cat /opt/promes/loki/nginx.yaml
server:
  http_listen_port: 9080
  grpc_listen_port: 0

positions:
  filename: /opt/promes/loki/positions.yaml

clients:
  - url: http://10.243.51.50:3100/loki/api/v1/push

scrape_configs:
- job_name: nginx
  static_configs:
  - targets:
      - localhost
    labels:
      job: nginxAccess
      __path__: /opt/rsync_log/access_http.log
      ip: "10.243.58.14"
      appId: PROMES
      softType: blackbox
  pipeline_stages:
  - match:
      selector: '{app="nginx"}'
      stages:
      - regex:
          expression: '^(?P<remote_addr>\\S+)   (?P<http_x_forwarded_for>\\S+)  (?P<http_x_forwarded_for2>\\S+) (?P<http_x_forwarded_for3>\\S+) (?P<time_iso8601>\\S+)  (?P<request_method>\\S+)    "(?P<document_uri>\\S+)"    "(?P<query_string>\\S+)"    (?P<request_http_protocol>\\S+) (?P<status>\\d{3}|-)    (?P<body_bytes_sent>\\d{3}|-)   (?P<request_time>\\S+)  "(?P<http_referer>\\S+)"    "(?P<user_agent>\\S+)"  traceId:(?P<traceId>\\S+),spanId:(?P<spanId>\\S+)   (?P<server_addr>\\S+)   (?P<hostname>\\S+)  (?P<host>\\S+)  (?P<remote_port>\\S+)   (?P<server_port>\\S+)   "(?P<upstream_addr>\\S+)"   "(?P<upstream_status>\\S+)" "(?P<upstream_response_time>\\S+)"  (?P<version>\\S+)?$'
      - labels:
          remote_addr:
          http_x_forwarded_for:
          http_x_forwarded_for2:
          http_x_forwarded_for3:
          timestamp:
          request_method:
          document_uri:
          query_string:
          request_http_protocol:
          status:
          body_bytes_sent:
          request_time:
          http_referer:
          user_agent:
          traceId:
          spanId:
          server_addr:
          hostname:
          host:
          remote_port:
          server_port:
          upstream_addr:
          upstream_status:
          upstream_response_time:
          version:
物理部署
物理部署很简单,可以直接下载二进制文件,官方还提供来repo,我们还可以编译
$ git clone https://github.com/grafana/loki $GOPATH/src/github.com/grafana/loki
$ cd $GOPATH/src/github.com/grafana/loki
$ make loki
然后直接用二进制文件加配置文件进行启动就可以了,配置文件在/etc/loki/promtail.yaml and /etc/loki/loki.yaml。
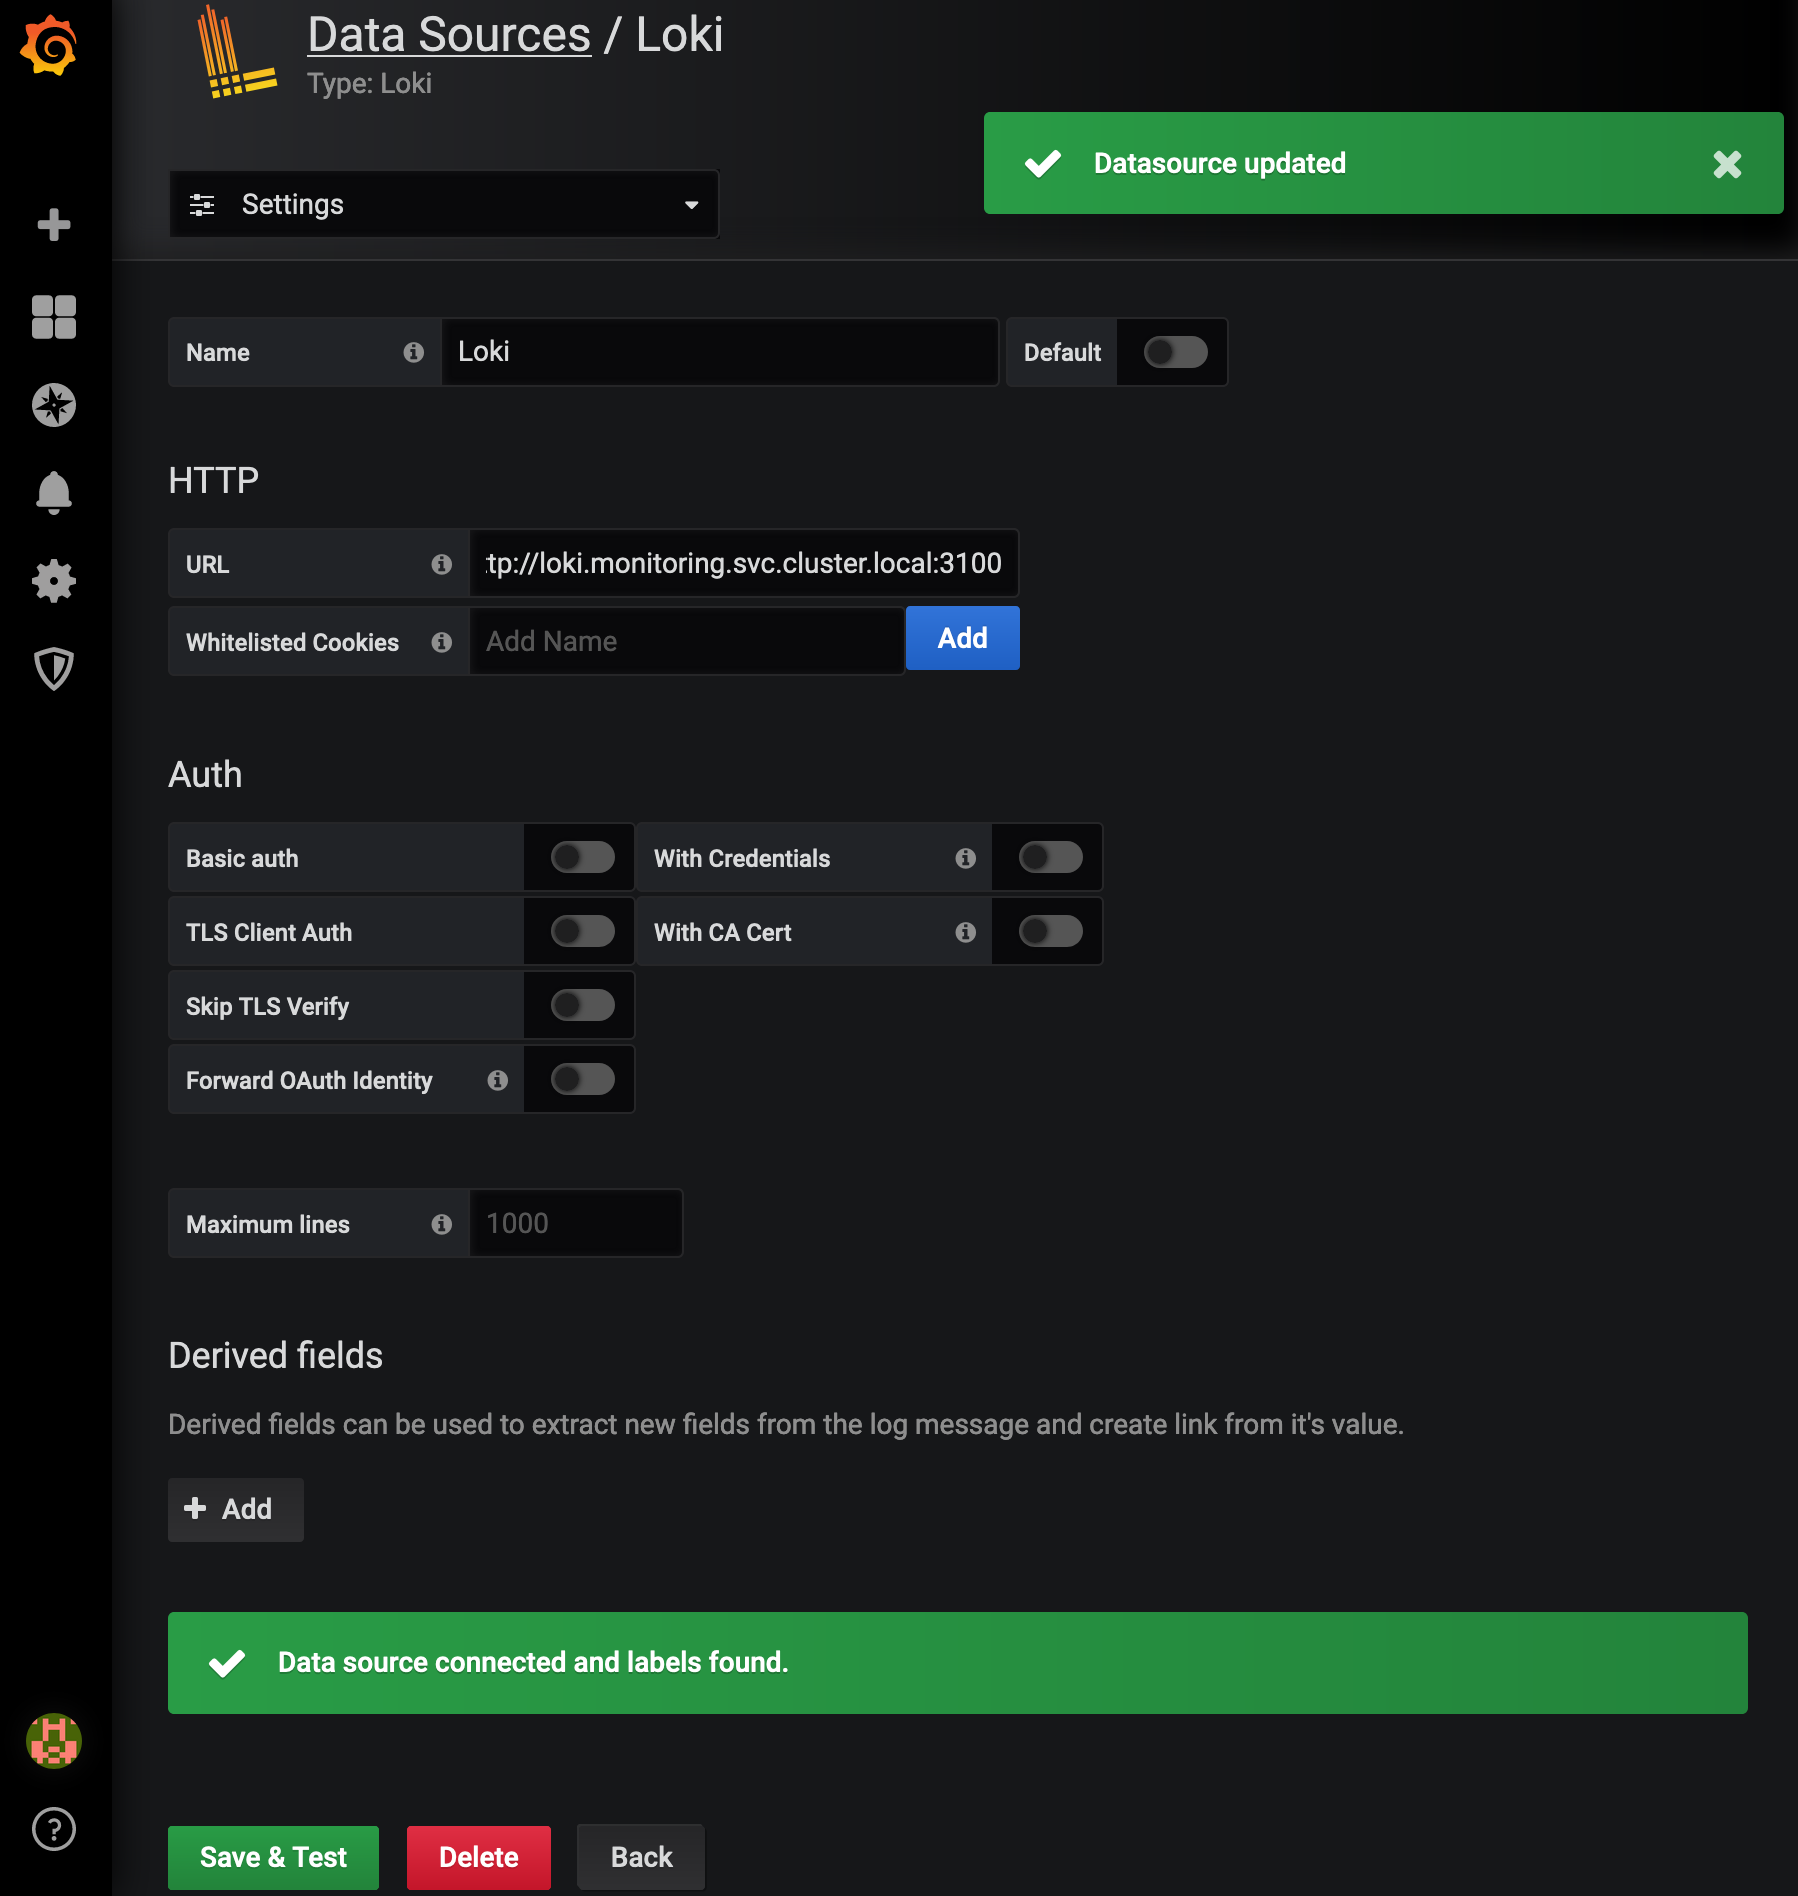
基本使用
下面我们就可以到grafana界面进行操作了,进入 grafana 界面,添加 loki 作为数据源,grafana原生就是支持loki的,所以直接添加loki 在集群中的地址,比如: http://loki.monitoring.svc.cluster.local:3100
数据源添加好了,我们就可以开始查询分析日志了,点击 Explore,下拉选择 loki 作为数据源,切到 Logs 模式(不用 Metrics 模式),在 Log labels 按钮那里就能通过 label 筛选日志了。
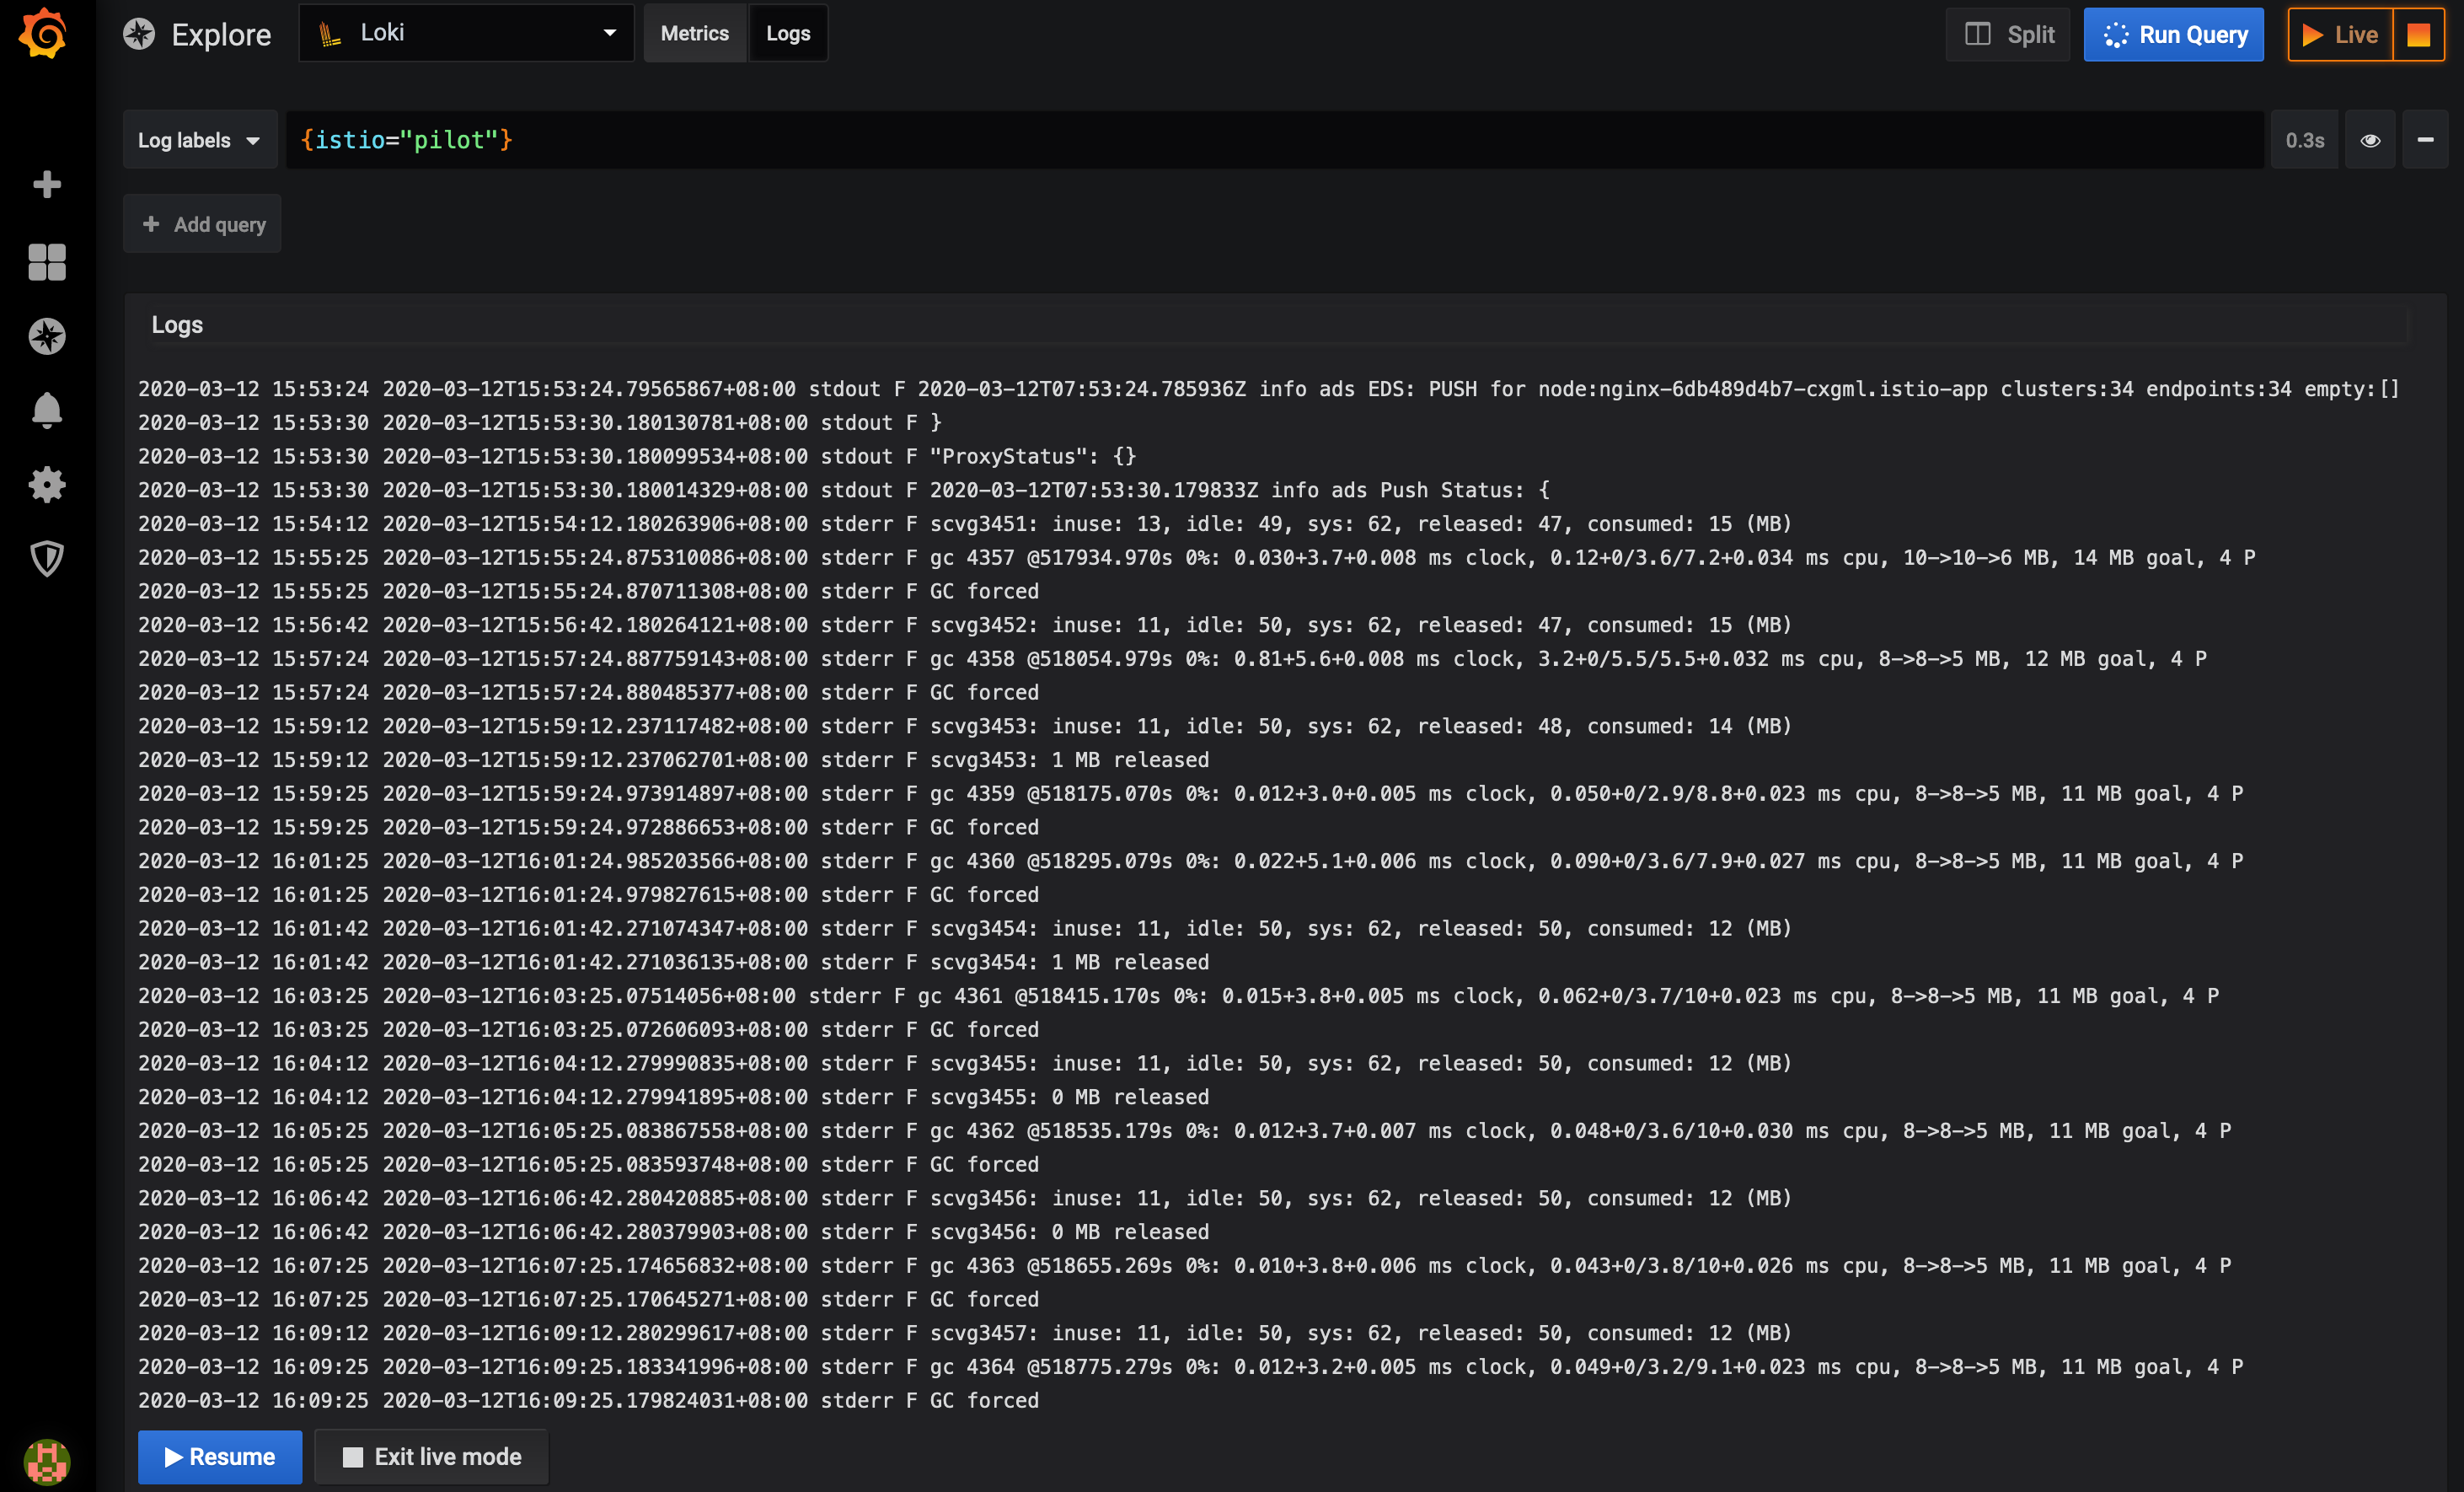
选择器
对于查询表达式的标签部分,将其包装在花括号中{},然后使用键值对的语法来选择标签,多个标签表达式用逗号分隔,比如:
{app="mysql",name="mysql-backup"}
目前支持以下标签匹配运算符:
=等于
!=不相等
=~正则表达式匹配
!~不匹配正则表达式
比如:
{name=~"mysql.+"}
{name!~"mysql.+"}
适用于Prometheus标签选择器规则同样也适用于Loki日志流选择器,可以查看官网的logQL.
基本原理
Promtail
promtail 可以理解为采集日志的 “Prometheus”. 它最巧妙的设计是完全复用了 Prometheus 的服务发现机制与 label 机制.
以 Kubernetes 服务发现为例, Prometheus 可以通过 Pod 的 Annotations 与 Labels 等信息来确定 Pod 是否需要抓取指标, 假如要的话 Pod 的指标暴露在哪个端口上, 以及这个 Pod 本身有哪些 label, 即 target label.
确定了这些信息之后, Prometheus 就可以去拉应用的指标了. 同时, 这些指标都会被打上 target label, 用于标注指标的来源. 等到在查询的时候, 我们就可以通过 target label, 比方说 pod_name=foo-123512 或 service=user-service 来获取特定的一个或一组 Pod 上的指标信息.
promtail 是一样的道理. 它也是通过 Pod 的一些元信息来确定该 Pod 的日志文件位置, 同时为日志打上特定的 target label. 但要注意, 这个 label 不是标注在每一行日志事件上的, 而是被标注在”整个日志”上的. 这里”整个日志”在 loki 中抽象为 stream(日志流). 这就是 loki 文档中所说的”不索引日志, 只索引日志流”. 最终在查询端, 我们通过这些 label 就可以快速查询一个或一组特定的 stream.
服务发现部分的代码非常直白, 可以去 pkg/promtail/targetmanager.go 中自己看一下, 提两个实现细节:
promtail 要求所有 target 都跟自己属于同一个 node, 处于其它 node 上的 target 会被忽略;
promtail 使用 target 的 __path__ label 来确定日志路径;
通过服务发现确定要收集的应用以及应用的日志路径后, promtail 就开始了真正的日志收集过程. 这里分三步:
1、用 fsnotify 监听对应目录下的文件创建与删除(处理 log rolling)
2、对每个活跃的日志文件起一个 goroutine 进行类似 tail -f 的读取, 读取到的内容发送给 channel
3、一个单独的 goroutine 会解析 channel 中的日志行, 分批发送给 loki 的 backend
监听
fsnotify负责监听
for {
    select {
    case event := <-t.watcher.Events:
        switch event.Op {
        case fsnotify.Create:
            // protect against double Creates.
            if _, ok := t.tails[event.Name]; ok {
                level.Info(t.logger).Log("msg", "got 'create' for existing file", "filename", event.Name)
                continue
            }

            // newTailer 中会启动一个 goroutine 来读目标文件
            tailer := newTailer(t.logger, t.handler, t.positions, t.path, event.Name)
            t.tails[event.Name] = tailer

        case fsnotify.Remove:
            tailer, ok := t.tails[event.Name]
            if ok {
                // 关闭 tailer
                helpers.LogError("stopping tailer", tailer.stop)
                delete(t.tails, event.Name)
            }
        }
    case err := <-t.watcher.Errors:
        level.Error(t.logger).Log("msg", "error from fswatch", "error", err)
    case <-t.quit:
        return
    }
}
一个for循环,一直来处理对应目录下的文件创建与删除的事件。
tail日志
newTailer() 这个方法中启动的日志文件读取逻辑
unc newTailer() {
    tail := tail.TailFile(path, tail.Config{
        Follow: true,
        Location: &tail.SeekInfo{
            Offset: positions.Get(path),
            Whence: 0,
        },
    })

    tailer := ...
    go tailer.run()
}

func (t *tailer) run() {
    for {
        select {
        case <-positionWait.C:
            // 定时同步当前读取位置
            pos := t.tail.Tell()
            t.positions.Put(t.path, pos)

        case line, ok := <-t.tail.Lines:
            // handler.Handle() 中是一些日志行的预处理逻辑, 最后将日志行转化为 `Entry` 对象扔进 channel
            if err := t.handler.Handle(model.LabelSet{}, line.Time, line.Text); err != nil {
                level.Error(t.logger).Log("msg", "error handling line", "error", err)
            }
        }
    }
}
这里直接调用了 hpcloud/tail 这个包来完成文件的 tail 操作. hpcloud/tail 的内部实现中, 在读到 EOF 之后, 同样调用了 fsnotify 来获取新内容写入的通知. fsnotify 这个包内部则是依赖了 inotify_init 和 inotify_add_watch 这两个系统调用。
日志channel
这里有一个单独的 goroutine 会读取所有 tailer 通过 channel 传过来的日志(Entry对象), 然后按批发送给 loki
for {
    // 每次发送之后要重置计时器
    maxWait.Reset(c.cfg.BatchWait)
    select {
    case <-c.quit:
        return
    case e := <-c.entries:
        // Batch 足够大之后, 执行发送逻辑
        if batchSize+len(e.Line) > c.cfg.BatchSize {
            c.send(batch)
            // 重置 Batch
            batchSize = 0
            batch = map[model.Fingerprint]*logproto.Stream{}
        }

        // 收到 Entry, 先写进 Batch 当中
        batchSize += len(e.Line)

        // 每个 entry 要根据 label 放进对应的日志流(Stream)中
        fp := e.labels.FastFingerprint()
        stream, ok := batch[fp]
        if !ok {
            stream = &logproto.Stream{
                Labels: e.labels.String(),
            }
            batch[fp] = stream
        }
        stream.Entries = append(stream.Entries, e.Entry)

    case <-maxWait.C:
        // 到达每个批次的最大等待时间, 同样执行发送
        if len(batch) > 0 {
            c.send(batch);
            batchSize = 0
            batch = map[model.Fingerprint]*logproto.Stream{}
        }
    }
}
用 channel + select 写 batch 逻辑真的挺优雅, 简单易读.
loki
loki的基本架构
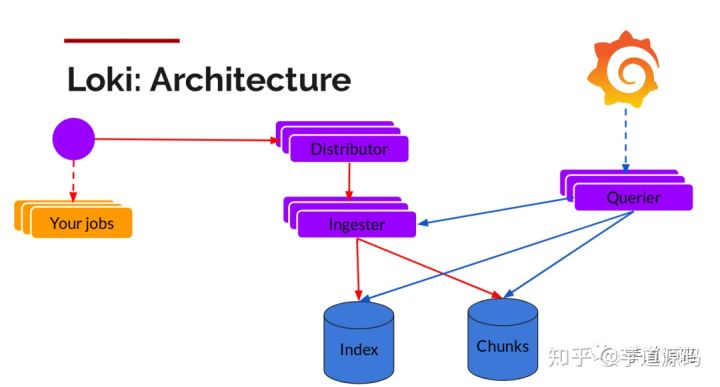
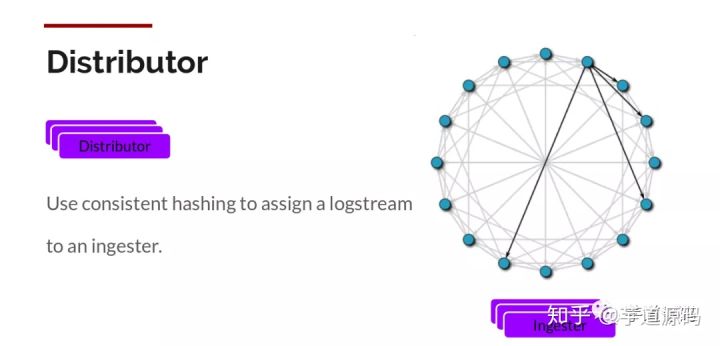
Distributor
我们都知道promtail封装后label后的log数据发生到loki,Distributor就是第一个接收日志的组件。由于日志的写入量可能很大,所以不能在它们传入时将它们写入数据库。这会毁掉数据库。我们需要批处理和压缩数据。
Loki通过构建压缩数据块来实现这一点,方法是在日志进入时对其进行gzip操作,组件ingester是一个有状态的组件,负责构建和刷新chunck,当chunk达到一定的数量或者时间后,刷新到存储中去。每个流的日志对应一个ingester,当日志到达Distributor后,根据元数据和hash算法计算出应该到哪个ingester上面。
我们具体看一下promtail 的日志写入请求, 请求体由 protobuf 编码, 格式如下:
// 一次写入请求, 包含多段日志流
type PushRequest struct {
    Streams []*Stream `protobuf:"bytes,1,rep,name=streams" json:"streams,omitempty"`
}
// 一段日志流, 包含它的 label, 以及这段日志流当中的每个日志事件: Entry
type Stream struct {
    Labels  string  `protobuf:"bytes,1,opt,name=labels,proto3" json:"labels,omitempty"`
    Entries []Entry `protobuf:"bytes,2,rep,name=entries" json:"entries"`
}
// 一个日志事件, 包含时间戳与内容
type Entry struct {
    Timestamp time.Time `protobuf:"bytes,1,opt,name=timestamp,stdtime" json:"timestamp"`
    Line      string    `protobuf:"bytes,2,opt,name=line,proto3" json:"line,omitempty"`
}
distributor 收到请求后, 会将一个 PushRequest 中的 Stream 根据 labels 拆分成多个 PushRequest, 这个过程使用一致性哈希:
streams := make([]streamTracker, len(req.Streams))
keys := make([]uint32, 0, len(req.Streams))
for i, stream := range req.Streams {
    // 获取每个 stream 的 label hash
    keys = append(keys, tokenFor(userID, stream.Labels))
    streams[i].stream = stream
}

// 根据 label hash 到 hash ring 上获取对应的 ingester 节点
// 这里的节点指 hash ring 上的节点, 一个节点可能有多个对等的 ingester 副本来做 HA
replicationSets := d.ring.BatchGet(keys, ring.Write)

// 将 Stream 按对应的 ingester 节点进行分组
samplesByIngester := map[string][]*streamTracker{}
ingesterDescs := map[string]ring.IngesterDesc{}
for i, replicationSet := range replicationSets {
    for _, ingester := range replicationSet.Ingesters {
        samplesByIngester[ingester.Addr] = append(samplesByIngester[ingester.Addr], &streams[i])
        ingesterDescs[ingester.Addr] = ingester
    }
}

for ingester, samples := range samplesByIngester {
    // 每组 Stream[] 又作为一个 PushRequest, 下发给对应的 ingester 节点
    d.sendSamples(localCtx, ingester, samples, &tracker)
}
在 All in One 的运行模式中, hash ring 直接存储在内存中. 在生产环境, 由于要起多个 distributor 节点做高可用, 这个 hash ring 会存储到外部的 Consul 集群中.
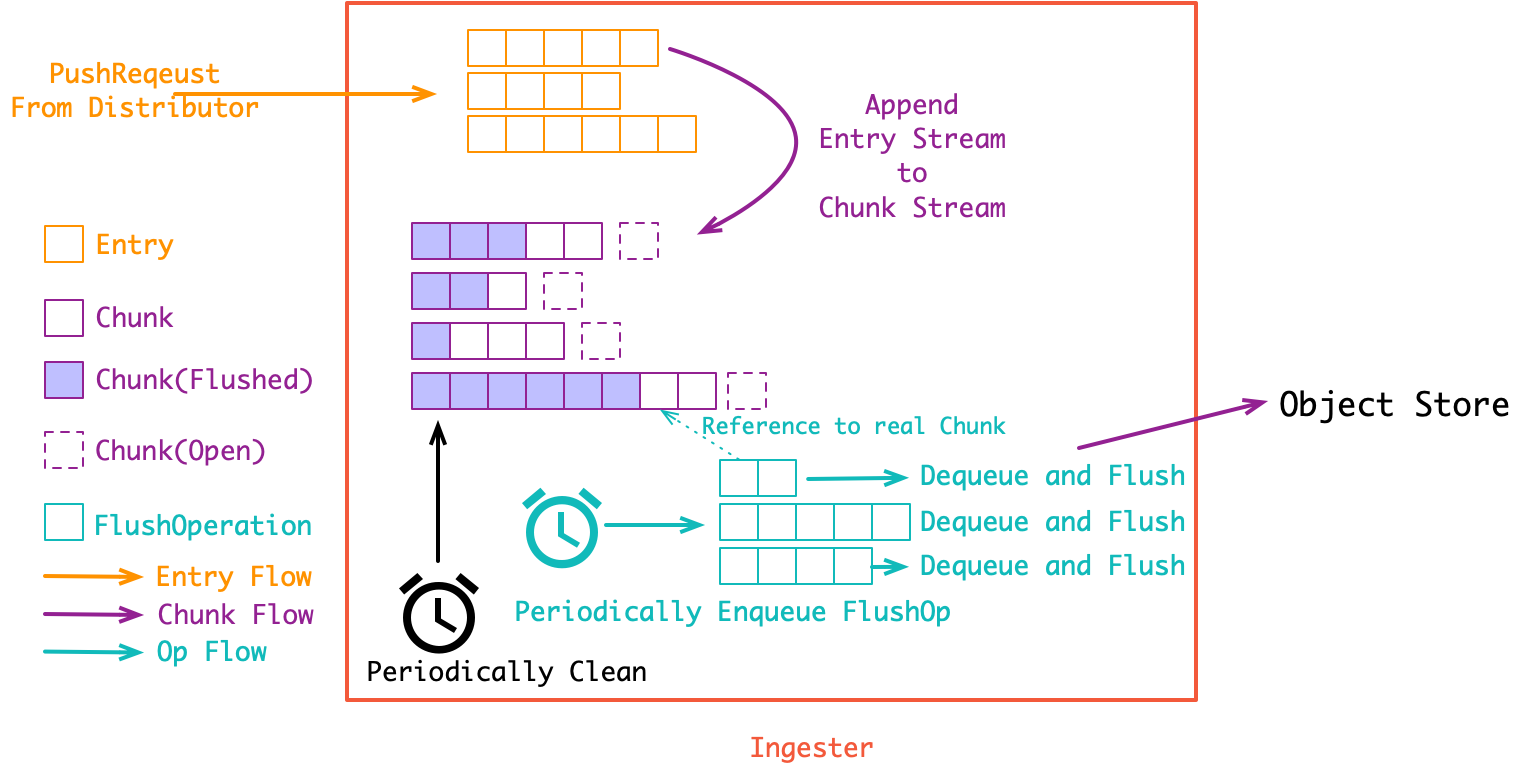
Ingester
ingester接收到日志并开始构建chunk:
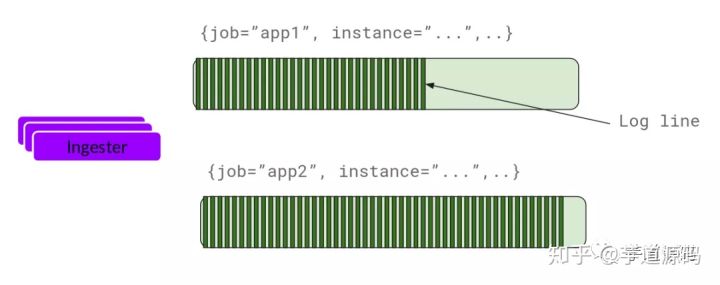
基本上就是将日志进行压缩并附加到chunk上面。一旦chunk“填满”(数据达到一定数量或者过了一定期限),ingester将其刷新到数据库。我们对块和索引使用单独的数据库,因为它们存储的数据类型不同。
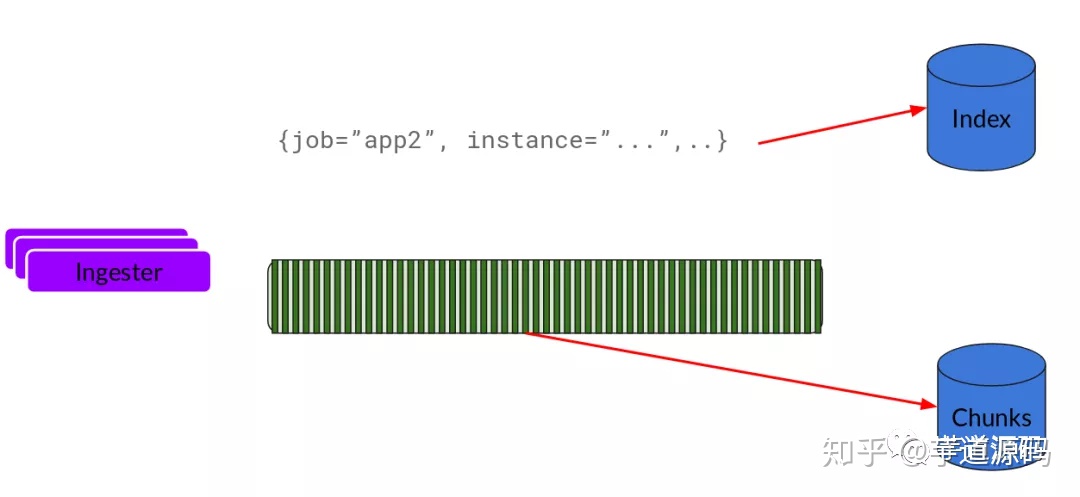
刷新一个chunk之后,ingester然后创建一个新的空chunk并将新条目添加到该chunk中。
我们再重代码层来分析一下,ingester 接收 distributor 下发的 PushRequest, 也就是多段日志流([]Entry). 在 ingester 内部会先将收到的 []Entry Append 到内存中的 Chunk 流([]Chunk). 同时会有一组 goroutine 异步将 Chunk 流存储到对象存储当中:
第一个 Append 过程很关键
func (i *instance) Push(ctx context.Context, req *logproto.PushRequest) error {
    for _, s := range req.Streams {
        // 将收到的日志流 Append 到内存中的日志流上, 同样地, 日志流按 label hash 索引
        fp := client.FastFingerprint(req.labels)
        stream, ok := i.streams[fp]
        if !ok {
            stream = newStream(fp, req.labels)
            // 这个过程中, 还会维护日志流的倒排索引(label -> stream)
            i.index.Add(labels, fp)
            i.streams[fp] = stream
        }
        stream.Push(ctx, s.Entries)
    }
    return nil
}

func (s *stream) Push(_ context.Context, entries []logproto.Entry) error {
    for i := range entries {
        // 假如当前 Chunk 已经关闭或者已经到达设定的最大 Chunk 大小, 则再创建一个新的 Chunk
        if s.chunks[0].closed || !s.chunks[0].chunk.SpaceFor(&entries[i]) {
            s.chunks = append(s.chunks, chunkDesc{
                chunk: chunkenc.NewMemChunk(chunkenc.EncGZIP),
            })
        }
        s.chunks[len(s.chunks)-1].chunk.Append(&entries[i])
    }
    return nil
}
Chunk 其实就是多条日志构成的压缩包. 将日志压成 Chunk 的意义是可以直接存入对象存储, 而对象存储是最便宜的(便宜是 loki 的核心目标之一). 在 一个 Chunk 到达指定大小之前它就是 open 的, 会不断 Append 新的日志(Entry) 到里面. 而在达到大小之后, Chunk 就会关闭等待持久化(强制持久化也会关闭 Chunk, 比如关闭 ingester 实例时就会关闭所有的 Chunk并持久化).
对 Chunk 的大小控制是一个调优要点:
假如 Chunk 容量过小: 首先是导致压缩效率不高. 同时也会增加整体的 Chunk 数量, 导致倒排索引过大. 最后, 对象存储的操作次数也会变多, 带来额外的性能开销;
假如 Chunk 过大: 一个 Chunk 的 open 时间会更长, 占用额外的内存空间, 同时, 也增加了丢数据的风险. 最后, Chunk 过大也会导致查询读放大, 比方说查一小时的数据却要下载整天的 Chunk;
丢数据问题: 所有 Chunk 要在 close 之后才会进行存储. 因此假如 ingester 异常宕机, 处于 open 状态的 Chunk, 以及 close 了但还没有来得及持久化的 Chunk 数据都会丢失. 从这个角度来说, ingester 其实也是 stateful 的, 在生产中可以通过给 ingester 跑多个副本来解决这个问题. 另外, ingester 里似乎还没有写 WAL, 这感觉是一个 PR 机会, 可以练习一下写存储的基本功.
异步存储过程就很简单了, 是一个一对多的生产者消费者模型:
// 一个 goroutine 将所有的待存储的 chunks enqueue
func (i *Ingester) sweepStream(instance *instance, stream *stream, immediate bool) {

    // 有一组待存储的队列(默认16个), 取模找一个队列把要存储的 chunk 的引用塞进去
    flushQueueIndex := int(uint64(stream.fp) % uint64(i.cfg.ConcurrentFlushes))
    firstTime, _ := stream.chunks[0].chunk.Bounds()
    i.flushQueues[flushQueueIndex].Enqueue(&flushOp{
        model.TimeFromUnixNano(firstTime.UnixNano()), instance.instanceID,
        stream.fp, immediate,
    })
}

// 每个队列都有一个 goroutine 作为消费者在 dequeue
func (i *Ingester) flushLoop(j int) {
    for {
        op := i.flushQueues[j].Dequeue()
        // 实际的存储操作在这个方法中, 存储完成后, Chunk 会被清理掉
        i.flushUserSeries(op.userID, op.fp, op.immediate)

        // 存储失败的 chunk 会重新塞回队列中
        if op.immediate && err != nil {
            op.from = op.from.Add(flushBackoff)
            i.flushQueues[j].Enqueue(op)
        }
    }
}
最后是清理过程, 同样是一个单独的 goroutine 定时在跑. ingester 里的所有 Chunk 会在持久化之后隔一小段时间才被清理掉. 这个”一小段时间”由 chunk-retain-time 参数进行控制(默认 15 分钟). 这么做是为了加速热点数据的读取(真正被人看的日志中, 有99%都是生成后的一小段时间内被查看的).
Querier
读取就非常简单了,由Querier负责给定一个时间范围和标签选择器,Querier查看索引以确定哪些块匹配,并通过greps将结果显示出来。它还从Ingester获取尚未刷新的最新数据,合并后返回。
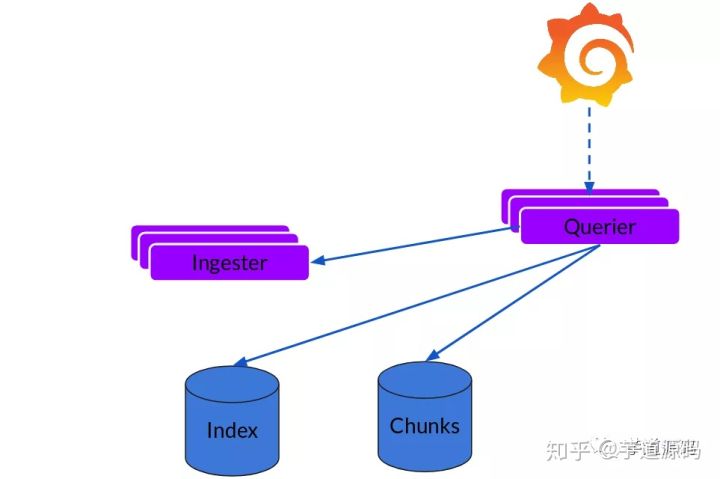
合并返回日志的时候,loki 里用了堆, 时间正序就用最小堆, 时间逆序就用最大堆:
// 这部分代码实现了一个简单的二叉堆, MinHeap 和 MaxHeap 实现了相反的 `Less()` 方法
type iteratorHeap []EntryIterator
func (h iteratorHeap) Len() int            { return len(h) }
func (h iteratorHeap) Swap(i, j int)       { h[i], h[j] = h[j], h[i] }
func (h iteratorHeap) Peek() EntryIterator { return h[0] }
func (h *iteratorHeap) Push(x interface{}) {
    *h = append(*h, x.(EntryIterator))
}
func (h *iteratorHeap) Pop() interface{} {
    old := *h
    n := len(old)
    x := old[n-1]
    *h = old[0 : n-1]
    return x
}
type iteratorMinHeap struct {
    iteratorHeap
}
func (h iteratorMinHeap) Less(i, j int) bool {
    return h.iteratorHeap[i].Entry().Timestamp.Before(h.iteratorHeap[j].Entry().Timestamp)
}
type iteratorMaxHeap struct {
    iteratorHeap
}
func (h iteratorMaxHeap) Less(i, j int) bool {
    return h.iteratorHeap[i].Entry().Timestamp.After(h.iteratorHeap[j].Entry().Timestamp)
}

// 将一组 Stream 的 iterator 合并成一个 HeapIterator
func NewHeapIterator(is []EntryIterator, direction logproto.Direction) EntryIterator {
    result := &heapIterator{}
    switch direction {
    case logproto.BACKWARD:
        result.heap = &iteratorMaxHeap{}
    case logproto.FORWARD:
        result.heap = &iteratorMinHeap{}
    default:
        panic("bad direction")
    }
    // pre-next each iterator, drop empty.
    for _, i := range is {
        result.requeue(i)
    }
    return result
}

func (i *heapIterator) requeue(ei EntryIterator) {
    if ei.Next() {
        heap.Push(i.heap, ei)
        return
    }
    if err := ei.Error(); err != nil {
        i.errs = append(i.errs, err)
    }
    helpers.LogError("closing iterator", ei.Close)
}

func (i *heapIterator) Next() bool {
    if i.curr != nil {
        i.requeue(i.curr)
    }
    if i.heap.Len() == 0 {
        return false
    }
    i.curr = heap.Pop(i.heap).(EntryIterator)
    currEntry := i.curr.Entry()
    // keep popping entries off if they match, to dedupe
    for i.heap.Len() > 0 {
        next := i.heap.Peek()
        nextEntry := next.Entry()
        if !currEntry.Equal(nextEntry) {
            break
        }

        next = heap.Pop(i.heap).(EntryIterator)
        i.requeue(next)
    }
    return true
}
扩展
1、Loki的索引存储可以是cassandra/bigtable/dynamodb来进行扩展,chuncks可以是各种对象存储,放入对象存储中进行扩展。
2、Querier和Distributor都是无状态的组件,可以水平扩展,可以使用负载均衡。
3、对于ingester他虽然是有状态的但是,当新的节点加入或者减少,整节点间的chunk会重新分配,已适应新的散列环。这些信息需要存储到etcd或者consul等第三方工具中。
2020.5.20
loki今天发布了1.5.0版本!引入了名为boltdb-shipper的新索引选项,这个新索引允许您仅使用对象存储(S3,GCS,文件系统等)来运行Loki。您不再需要单独的专用索引存储(DynamoDB,Bigtable,Cassandra等)!
该boltdb-shipper索引使用内存中的boltdb索引,但会定期将快照发送到对象存储。这允许通过对象存储共享索引信息。
将来可扩展可以通过boltdb-shipper索引和memberlist的gossip来完成集群功能。
在云存储上,ring的信息可以通过gossip协议来进行同步。可以看一下下面的这个配置,基于s3和memberlist的可扩展模式
auth_enabled: false

server:
  http_listen_port: 3100

distributor:
  ring:
    store: memberlist

ingester:
  lifecycler:
    ring:
      kvstore:
        store: memberlist
      replication_factor: 1
    final_sleep: 0s
  chunk_idle_period: 5m
  chunk_retain_period: 30s

memberlist:
  abort_if_cluster_join_fails: false

  # Expose this port on all distributor, ingester
  # and querier replicas.
  bind_port: 7946

  # You can use a headless k8s service for all distributor,
  # ingester and querier components.
  join_members:
  - loki-gossip-ring.loki.svc.cluster.local:7946

  max_join_backoff: 1m
  max_join_retries: 10
  min_join_backoff: 1s

schema_config:
  configs:
  - from: 2020-05-15
    store: boltdb-shipper
    object_store: s3
    schema: v11
    index:
      prefix: index_
      period: 168h

storage_config:
 boltdb_shipper:
   active_index_directory: /loki/index
   cache_location: /loki/index_cache
   resync_interval: 5s
   shared_store: s3

 aws:
   s3: s3://access_key:secret_access_key@custom_endpoint/bucket_name
   s3forcepathstyle: true

limits_config:
  enforce_metric_name: false
  reject_old_samples: true
  reject_old_samples_max_age: 168h