nginx [engine x] is an HTTP and reverse proxy server, a mail proxy server, and a generic TCP/UDP proxy server.关于nginx的介绍就不多谈了,这里主要聊下如何打造nginx集群的监控系统。
监控演化
目前国内大多数互联网都是选择nginx构建web转发集群,那么如何构建nginx集群的监控系统?
下面这个监控方案的历程,大体也说明了nginx的进化发展。
2011年左右
当时并没有合适的开源工具,只能自写python脚本,一方面是通过nginx的status模块获取少量指标如处理请求数,连接数等等,另一方面是通过定期跑nginx日志生成监控数据,写入mysql进行存储,然后通过自研的监控系统展示相关监控指标。其中,指标的主要维度是域名。这个方案除了跑nginx日志消耗过多资源以及需要大量开发工作外,没啥大问题,就是有新的监控需求时很头疼,得改脚本。
2013年左右
这时候阿里的tengine开始发力,开发各种插件并在阿里内部推广使用,其中就包括了更为强大的status模块。只是tengine魔改了大量nginx的内部实现,导致大多数模块与nginx并不兼容。于是就有了这个项目hnlq715/status-nginx-module,完美支持nginx,并成功重构了当时上百台nginx,日请求量几十亿的的监控系统,此时能满足绝大多数监控需求。指标的主要维度仍然是域名。
2015年左右
这时候注意到了prometheus的出现,感叹于其强大,于是考虑基于prometheus实现nginx的监控。而此时,vozlt/nginx-module-vts已经使用很广,于是创建了这个项目hnlq715/nginx-vts-exporter,用于将vts的输出内容转化为prometheus的格式,便于prometheus抓取。基于grafana提供监控查询及UI展示,这时候算是步入真正的现代化监控系统,此时的指标维度已经细化到具体的URI。
2017年左右
然而上一个方案还是有个短板,那就是nginx-module-vts对响应时间的处理太过粗糙,只给了一个平均值,无法对P99,P90或是P50给出直观的数据。于是基于lua内嵌在nginx里跑监控指标,demo在这hnlq715/nginx-prometheus-metrics,这种方式可以直接用prometheus的histogram类型统计响应时间等指标,并在prometheus层聚合。此时,才算是真正的现代化监控系统。指标维度可以完全自定义,且更加多维化。
总结
基于prometheus聚合nginx的监控数据是非常好的选择。上述项目能够在一定程度上帮助实现,不用手写代码或是通过极少的lua代码实现一套现代化的nginx监控系统。当然,也可以聚合其他诸如redis、mysql、node等各类系统的监控数据到prometheus进行统一管理。
监控
status
原版的 NGINX 会在一个简单的状态页面上显示几个与服务器状态有关的基本指标,它们由你启用的 HTTP stub status module 所提供。
你可以浏览状态页看到你的指标:
Active connections: 24
server accepts handled requests
1156958 1156958 4491319
Reading: 0 Writing: 18 Waiting : 6
下表是 Nginx 提供的监控参数及其简单释义。
参数名称 参数描述
Active connections  当前活跃的用户连接(包含Waiting状态)
accepts 接收到的用户连接总数
handled Nginx处理的用户连接总数
requests    用户请求总数
Reading 当前连接中Nginx读取请求首部的个数
Writing 当前连接中Nginx写返回给用户的个数
Waiting 当前没有请求的活跃用户连接数
这些提供了我们简单的指标。
- 当用户请求连接Nginx服务器时,accepts计数器会加一。且当服务器处理该连接请求时,handled计数器同样会加一。一般而言,两者的值是相等的,除非达到了某些资源极限(如worker_connection的限制)。
- 用户连接请求被处理,就会进入 active 状态。如果该连接没有其他 request,则进入 waiting 的子状态;如果有 request,nginx 会读取 request 的 header,计数器 request 加一,进入 reading 的子状态。 reading 状态持续时间非常短,header 被读取后就会进入 writing 状态。事实上,直到服务器将响应结果返回给用户之前,该连接会一直保持 writing 状态。所以说,writing 状态一般会被长时间占用。
监控需求
三类指标
基本活动指标
Accepts(接受)、Handled(已处理)、Requests(请求数)是一直在增加的计数器。Active(活跃)、Waiting(等待)、Reading(读)、Writing(写)随着请求量而增减。
提醒指标: 丢弃连接 被丢弃的连接数目等于 Accepts 和 Handled 之差(NGINX 中),或是可直接得到的标准指标(NGINX Plus 中)。在正常情况下,丢弃连接数应该是零。如果在每个单位时间内丢弃连接的速度开始上升,那么应该看看是否资源饱和了。
提醒指标: 每秒请求数 按固定时间间隔采样你的请求数据(开源 NGINX 的requests或者 NGINX Plus 中total) 会提供给你单位时间内(通常是分钟或秒)所接受的请求数量。监测这个指标可以查看进入的 Web 流量尖峰,无论是合法的还是恶意的,或者突然的下降,这通常都代表着出现了问题。每秒请求数若发生急剧变化可以提醒你的环境出现问题了,即使它不能告诉你确切问题的位置所在。请注意,所有的请求都同样计数,无论 URL 是什么。
错误指标
NGINX 错误指标告诉你服务器是否经常返回错误而不是正常工作。客户端错误返回4XX状态码,服务器端错误返回5XX状态码。
提醒指标: 服务器错误率
服务器错误率等于在单位时间(通常为一到五分钟)内5xx错误状态代码的总数除以状态码(1XX,2XX,3XX,4XX,5XX)的总数。如果你的错误率随着时间的推移开始攀升,调查可能的原因。如果突然增加,可能需要采取紧急行动,因为客户端可能收到错误信息。
收集错误度量 配置 NGINX 的日志模块将响应码写入访问日志
性能指标
- 提醒指标: 请求处理时间 请求处理时间指标记录了 NGINX 处理每个请求的时间,从读到客户端的第一个请求字节到完成请求。较长的响应时间说明问题在上游。
实现
目前prometheus还没有官方的exporter。目前有两种采集的办法
nginx-lua-prometheus
这个是以lua插件的形式暴露出一些基础连接信息
下载地址:https://github.com/knyar/nginx-lua-prometheus
nginx-lua-prometheus测试
解压源码包
tar -zxvf nginx-1.6.0.tar.gz
开始进行编译。
[root@test nginx-1.6.0]# pwd
/opt/nginx-1.6.0
[root@test nginx-1.6.0]# ./configure --prefix=/usr/local/nginx --with-http_stub_status_module --with-http_ssl_module --with-http_realip_module --add-module=./nginx-sticky-module-1.1 --add-module=./nginx_upstream_check_module-master --add-module=./nginx_upstream_hash-0.3.1 --add-module=./lua-nginx-module-0.9.10 --add-module=./nginx-concat-module
查看编译后安装的模块
[root@test sbin]# ./nginx -V
nginx version: nginx/1.6.0
built by gcc 4.1.2 20080704 (Red Hat 4.1.2-48)
TLS SNI support disabled
configure arguments: --prefix=/usr/local/nginx --with-http_stub_status_module --with-http_ssl_module --with-http_realip_module --add-module=./nginx-sticky-module-1.1 --add-module=./nginx_upstream_check_module-master --add-module=./nginx_upstream_hash-0.3.1 --add-module=./lua-nginx-module-0.9.10 --add-module=./nginx-concat-module
[root@test sbin]# pwd
/usr/local/nginx/sbin
[root@test sbin]#
之后make & make install
启动nginx
[root@test sbin]# ./nginx
[root@test sbin]# ps -ef |grep nginx
root     15585     1  0 15:45 ?        00:00:00 nginx: master process ./nginx
nobody   15586 15585  0 15:45 ?        00:00:00 nginx: worker process
nobody   15587 15585  0 15:45 ?        00:00:00 nginx: worker process
nobody   15588 15585  0 15:45 ?        00:00:00 nginx: worker process
nobody   15589 15585  0 15:45 ?        00:00:00 nginx: worker process
nobody   15590 15585  0 15:45 ?        00:00:00 nginx: worker process
nobody   15591 15585  0 15:45 ?        00:00:00 nginx: worker process
nobody   15592 15585  0 15:45 ?        00:00:00 nginx: worker process
nobody   15593 15585  0 15:45 ?        00:00:00 nginx: worker process
root     15597  3959  0 15:45 pts/2    00:00:00 grep nginx
浏览器访问
开始安装对应监控模块
下载最新的release版本nginx-lua-prometheus-0.1-20170610.tar.gz
创建目录
/usr/local/nginx/lua
上传gz包,并解压
[root@test nginx-lua-prometheus-0.1-20170610]# pwd
/usr/local/nginx/lua/nginx-lua-prometheus-0.1-20170610
[root@test nginx-lua-prometheus-0.1-20170610]# ls
nginx-lua-prometheus-0.1-20170610.rockspec  prometheus.lua  prometheus_test.lua  README.md
[root@test nginx-lua-prometheus-0.1-20170610]#
修改nginx.conf
lua_shared_dict prometheus_metrics 10M;
lua_package_path "/usr/local/nginx/lua/nginx-lua-prometheus-0.1-20170610/?.lua";
init_by_lua '
  prometheus = require("prometheus").init("prometheus_metrics")
  metric_requests = prometheus:counter(
    "nginx_http_requests_total", "Number of HTTP requests", {"host", "status"})
  metric_latency = prometheus:histogram(
    "nginx_http_request_duration_seconds", "HTTP request latency", {"host"})
  metric_connections = prometheus:gauge(
    "nginx_http_connections", "Number of HTTP connections", {"state"})
';
log_by_lua '
  local host = ngx.var.host:gsub("^www.", "")
  metric_requests:inc(1, {host, ngx.var.status})
  metric_latency:observe(ngx.now() - ngx.req.start_time(), {host})
';

server {
  listen 9145;
  #allow 0.0.0.0/16;
   #deny all;
  location /metrics {
    content_by_lua '
      metric_connections:set(ngx.var.connections_reading, {"reading"})
      metric_connections:set(ngx.var.connections_waiting, {"waiting"})
      metric_connections:set(ngx.var.connections_writing, {"writing"})
      prometheus:collect()
    ';
  }
}
重新加载nginx
[root@test conf]# ../sbin/nginx -s reload
访问nginx的页面
http://10.19.250.191:9145/metrics
nginx-vts-exporter
目前的版本是nginx-vts-exporter-0.8.3.linux-amd64.tar.gz
下载地址是:https://github.com/hnlq715/nginx-vts-exporter/releases
nginx-vts-exporter测试
由于nginx-vts-exporter依赖于Nginx的nginx-module-vts模块,所以这里需要重新编译下Nginx。之后再安装这个exporter
VTS安装步骤
1、 下载nginx-module-vts
https://github.com/vozlt/nginx-module-vts/releases/tag/v0.1.15
解压后目录为
/opt/nginx-module-vts-0.1.15
2、 重新编译nginx
说明 由于 nginx_upstream_check_module-master 模块有问题。
所以编译的时候的配置语句为
./configure --with-http_stub_status_module --with-http_ssl_module --with-http_realip_module --add-module=./nginx-sticky-module-1.1 --add-module=./lua-nginx-module-0.9.10 --add-module=./nginx-concat-module --add-module=/opt/nginx-module-vts-0.1.15
3、 开始安装
make & make install
4、 修改配置文件
http {
    vhost_traffic_status_zone;

    ...

server {
      listen 8088;
      location /status {
            vhost_traffic_status_display;
            vhost_traffic_status_display_format html;
        }
    }
}
5、 重新加载配置
[root@test conf]# ../sbin/nginx -s reload
访问页面
http://10.19.250.191:8088/status
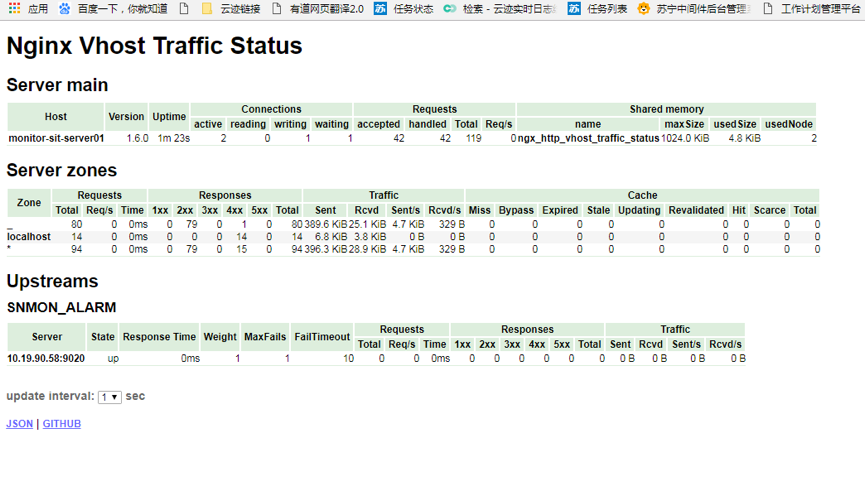
可见,vts的本身监控就是比较全面的,就是为监控而生。
安装启动探针
[root@test nginx-vts-exporter-0.8.3.linux-amd64]# nohup /opt/nginx-vts-exporter-0.8.3.linux-amd64/./nginx-vts-exporter  -nginx.scrape_uri="http://10.19.250.191:8088/status/format/json" 2>&1 &

[root@test nginx-vts-exporter-0.8.3.linux-amd64]# nohup: appending output to `nohup.out
配置访问
curl -XPUT http://10.27.136.227:9996/v1/agent/service/register   -d '
{
    "id": "prometheus-exporter11",
    "name": "promether-exporter",
    "address": "10.19.250.191",
    "port": 9913,
    "tags": [
          "SNMON",
                "NJXZ",
                "DEV",
                "10.19.250.191",
                "nginx-9913"
    ],
    "checks": [
        {
            "script": "curl http://10.19.250.9913/metrics >/dev/null 2>&1",
            "interval": "10s"
        }
    ]
}'
查看
http://10.27.136.227:9099/targets
查看Metric
http://10.19.250.191:9913/metrics
综合来说,vts的指标本来就比较全面,结合prometheus,更加匹配我们的监控需求,但是要重新编译nginx比较麻烦,最终还是使用vts。