golang 开发过程进行性能调优,pprof 一定是一个大杀器般的工具。
PProf
想要进行性能优化,首先瞩目在 Go 自身提供的工具链来作为分析依据,本文将带你学习、使用 Go 后花园,涉及如下:
runtime/pprof:采集程序(非 Server)的运行数据进行分析
net/http/pprof:采集 HTTP Server 的运行时数据进行分析
其实net/http/pprof中只是使用runtime/pprof包来进行封装了一下,并在http端口上暴露出来
基本原理
pprof 是用于可视化和分析性能分析数据的工具,pprof 以 profile.proto 读取分析样本的集合,并生成报告以可视化并帮助分析数据(支持文本和图形报告)
profile.proto 是一个 Protocol Buffer v3 的描述文件,它描述了一组 callstack 和 symbolization 信息, 作用是表示统计分析的一组采样的调用栈,是很常见的 stacktrace 配置文件格式
基本使用
1、使用方式
- 基准测试文件:例如使用命令go test . -bench . -cpuprofile prof.cpu 生成采样文件后,再通过命令 go tool pprof [binary] prof.cpu 来进行分析。
- import _ net/http/pprof:如果我们的应用是一个web服务,我们可以在http服务启动的代码文件(eg: main.go)添加 import _ net/http/pprof,这样我们的服务 便能自动开启profile功能,有助于我们直接分析采样结果。
- 通过在代码里面调用 runtime.StartCPUProfile或者runtime.WriteHeapProfile。
2、支持什么使用模式
- Report generation:报告生成
- Interactive terminal use:交互式终端使用
- Web interface:Web 界面
3、可以做什么
- CPU Profiling:CPU 分析,按照一定的频率采集所监听的应用程序 CPU(含寄存器)的使用情况,可确定应用程序在主动消耗 CPU 周期时花费时间的位置
- Memory Profiling:内存分析,在应用程序进行堆分配时记录堆栈跟踪,用于监视当前和历史内存使用情况,以及检查内存泄漏
- Block Profiling:阻塞分析,记录 goroutine 阻塞等待同步(包括定时器通道)的位置
- Mutex Profiling:互斥锁分析,报告互斥锁的竞争情况
上面只是常用的一部分,还有如下都可以分析,只不过使用的不多。
Profile Descriptions:
allocs: A sampling of all past memory allocations
block: Stack traces that led to blocking on synchronization primitives
cmdline: The command line invocation of the current program
goroutine: Stack traces of all current goroutines
heap: A sampling of memory allocations of live objects. You can specify the gc GET parameter to run GC before taking the heap sample.
mutex: Stack traces of holders of contended mutexes
profile: CPU profile. You can specify the duration in the seconds GET parameter. After you get the profile file, use the go tool pprof command to investigate the profile.
threadcreate: Stack traces that led to the creation of new OS threads
trace: A trace of execution of the current program. You can specify the duration in the seconds GET parameter. After you get the trace file, use the go tool trace command to investigate the trace.
使用
第一种使用方式
编写测试用例
package data

import "testing"

const url = "https://github.com/EDDYCJY"

func TestAdd(t *testing.T) {
    s := Add(url)
    if s == "" {
        t.Errorf("Test.Add error!")
    }
}

func BenchmarkAdd(b *testing.B) {
    for i := 0; i < b.N; i++ {
        Add(url)
    }
}
执行测试用例
$ go test -bench=. -cpuprofile=cpu.prof
pkg: github.com/EDDYCJY/go-pprof-example/data
BenchmarkAdd-4       10000000           187 ns/op
PASS
ok      github.com/EDDYCJY/go-pprof-example/data    2.300s
启动 PProf 可视化界面进行分析
方法一:
$ go tool pprof -http=:8080 cpu.prof
方法二:
$ go tool pprof cpu.prof
$ (pprof) web
第二种使用方式
我们最常用的就是第二种方式,import _ net/http/pprof,我们将编写一个简单且有点问题的例子,用于基本的程序初步分析
package main

import (
    "log"
    "net/http"
    _ "net/http/pprof"
    "github.com/EDDYCJY/go-pprof-example/data"
)

func main() {
    go func() {
        for {
            log.Println(data.Add("https://github.com/EDDYCJY"))
        }
    }()

    http.ListenAndServe("0.0.0.0:6060", nil)
}


package data

var datas []string

func Add(str string) string {
    data := []byte(str)
    sData := string(data)
    datas = append(datas, sData)

    return sData
}
运行这个文件,你的 HTTP 服务会多出 /debug/pprof 的 endpoint 可用于观察应用程序的情况
交互分析
通过 Web 界面
查看当前总览:访问 http://127.0.0.1:6060/debug/pprof/
/debug/pprof/

profiles:
0    block
5    goroutine
3    heap
0    mutex
9    threadcreate

full goroutine stack dump
这个页面中有许多子页面,咱们继续深究下去,看看可以得到什么?
cpu(CPU Profiling): $HOST/debug/pprof/profile,默认进行 30s 的 CPU Profiling,得到一个分析用的 profile 文件
block(Block Profiling):$HOST/debug/pprof/block,查看导致阻塞同步的堆栈跟踪
goroutine:$HOST/debug/pprof/goroutine,查看当前所有运行的 goroutines 堆栈跟踪
heap(Memory Profiling): $HOST/debug/pprof/heap,查看活动对象的内存分配情况
mutex(Mutex Profiling):$HOST/debug/pprof/mutex,查看导致互斥锁的竞争持有者的堆栈跟踪
threadcreate:$HOST/debug/pprof/threadcreate,查看创建新OS线程的堆栈跟踪
通过交互式终端使用
(1)获取cpu相关:go tool pprof http://localhost:6060/debug/pprof/profile?seconds=60
$ go tool pprof http://localhost:6060/debug/pprof/profile\?seconds\=60

Fetching profile over HTTP from http://localhost:6060/debug/pprof/profile?seconds=60
Saved profile in /Users/eddycjy/pprof/pprof.samples.cpu.007.pb.gz
Type: cpu
Duration: 1mins, Total samples = 26.55s (44.15%)
Entering interactive mode (type "help" for commands, "o" for options)
(pprof)
执行该命令后,需等待 60 秒(可调整 seconds 的值),pprof 会进行 CPU Profiling。结束后将默认进入 pprof 的交互式命令模式,可以对分析的结果进行查看或导出。具体可执行 pprof help 查看命令说明
(pprof) top10
Showing nodes accounting for 25.92s, 97.63% of 26.55s total
Dropped 85 nodes (cum <= 0.13s)
Showing top 10 nodes out of 21
      flat  flat%   sum%        cum   cum%
    23.28s 87.68% 87.68%     23.29s 87.72%  syscall.Syscall
     0.77s  2.90% 90.58%      0.77s  2.90%  runtime.memmove
     0.58s  2.18% 92.77%      0.58s  2.18%  runtime.freedefer
     0.53s  2.00% 94.76%      1.42s  5.35%  runtime.scanobject
     0.36s  1.36% 96.12%      0.39s  1.47%  runtime.heapBitsForObject
     0.35s  1.32% 97.44%      0.45s  1.69%  runtime.greyobject
     0.02s 0.075% 97.51%     24.96s 94.01%  main.main.func1
     0.01s 0.038% 97.55%     23.91s 90.06%  os.(*File).Write
     0.01s 0.038% 97.59%      0.19s  0.72%  runtime.mallocgc
     0.01s 0.038% 97.63%     23.30s 87.76%  syscall.Write
flat:给定函数上运行耗时
flat%:同上的 CPU 运行耗时总比例
sum%:给定函数累积使用 CPU 总比例
cum:当前函数加上它之上的调用运行总耗时
cum%:同上的 CPU 运行耗时总比例
最后一列为函数名称,在大多数的情况下,我们可以通过这五列得出一个应用程序的运行情况,加以优化 🤔
(2)获取内存相关:go tool pprof http://localhost:6060/debug/pprof/heap
$ go tool pprof http://localhost:6060/debug/pprof/heap
Fetching profile over HTTP from http://localhost:6060/debug/pprof/heap
Saved profile in /Users/eddycjy/pprof/pprof.alloc_objects.alloc_space.inuse_objects.inuse_space.008.pb.gz
Type: inuse_space
Entering interactive mode (type "help" for commands, "o" for options)
(pprof) top
Showing nodes accounting for 837.48MB, 100% of 837.48MB total
      flat  flat%   sum%        cum   cum%
  837.48MB   100%   100%   837.48MB   100%  main.main.func1
-inuse_space:分析应用程序的常驻内存占用情况
-alloc_objects:分析应用程序的内存临时分配情况
(3)获取阻塞相关:go tool pprof http://localhost:6060/debug/pprof/block
(4)获取锁相关:go tool pprof http://localhost:6060/debug/pprof/mutex
PProf 可视化界面
1、web命令
启动 PProf 可视化界面正常有两种方式,一种就是对cpu文件进行分析,比如上面bench的cpu.prof,或者交互生成的pprof.samples.cpu.007.pb.gz,在交互的命令中输入web,就可以通过web进行访问。
$ (pprof) web
如果出现 Could not execute dot; may need to install graphviz.,就是提示你要安装 graphviz 了 ,我们简单说明一下安装(详细请右拐谷歌)。
brew install graphviz # for macos
apt install graphviz # for ubuntu
yum install graphviz # for centos
查看 PProf 可视化界面,下面是url
(1)Top
(2)Graph
框越大,线越粗代表它占用的时间越大哦
(3)Peek
(4)Source
通过 PProf 的可视化界面,我们能够更方便、更直观的看到 Go 应用程序的调用链、使用情况等,并且在 View 菜单栏中,还支持如上多种方式的切换
我们也可以直接在上面的命令行中直接操作,安装完成后,我们继续在上文的交互式终端里输入 web,注意,虽然这个命令的名字叫“web”,但它的实际行为是产生一个 .svg 文件,并调用你的系统里设置的默认打开 .svg 的程序打开它。如果你的系统里打开 .svg 的默认程序并不是浏览器(比如可能是你的代码编辑器),这时候你需要设置一下默认使用浏览器打开 .svg 文件,相信这难不倒你。
2、PProf 火焰图
另一种可视化数据的方法是火焰图,原先是 uber 开源的一个工具:go-torch,可以直接读取 golang profiling 数据,并生成一个火焰图的 svg 文件。火焰图 svg 文件可以通过浏览器打开,它对于调用图的最优点是它是动态的:可以通过点击每个方块来 zoom in 分析它上面的内容。
现在这个项目已经合并到工具pprof中去了
go-torch is deprecated, use pprof instead
需要安装FlameGraph的脚本
git clone https://github.com/brendangregg/FlameGraph.git
把flamegraph.pl拷到我们机器环境变量$PATH的路径中去
cp flamegraph.pl /usr/local/bin
在终端输入 flamegraph.pl -h 是否安装FlameGraph成功
1.获取cpuprofile
获取最近10秒程序运行的cpuprofile,-seconds参数不填默认为30。
go tool pprof http://127.0.0.1:8080/debug/pprof/profile -seconds 10
等10s后会生成一个: pprof.samples.cpu.001.pb.gz文件
2.生成火焰图
go tool pprof -http=:8081 ~/pprof/pprof.samples.cpu.001.pb.gz
其中-http=:8081会启动一个http服务,端口为8081,然后浏览器会弹出此文件的图解
还是需要基于上面安装的graphviz,如果没有安装需要先安装一下。然后可以在界面选择
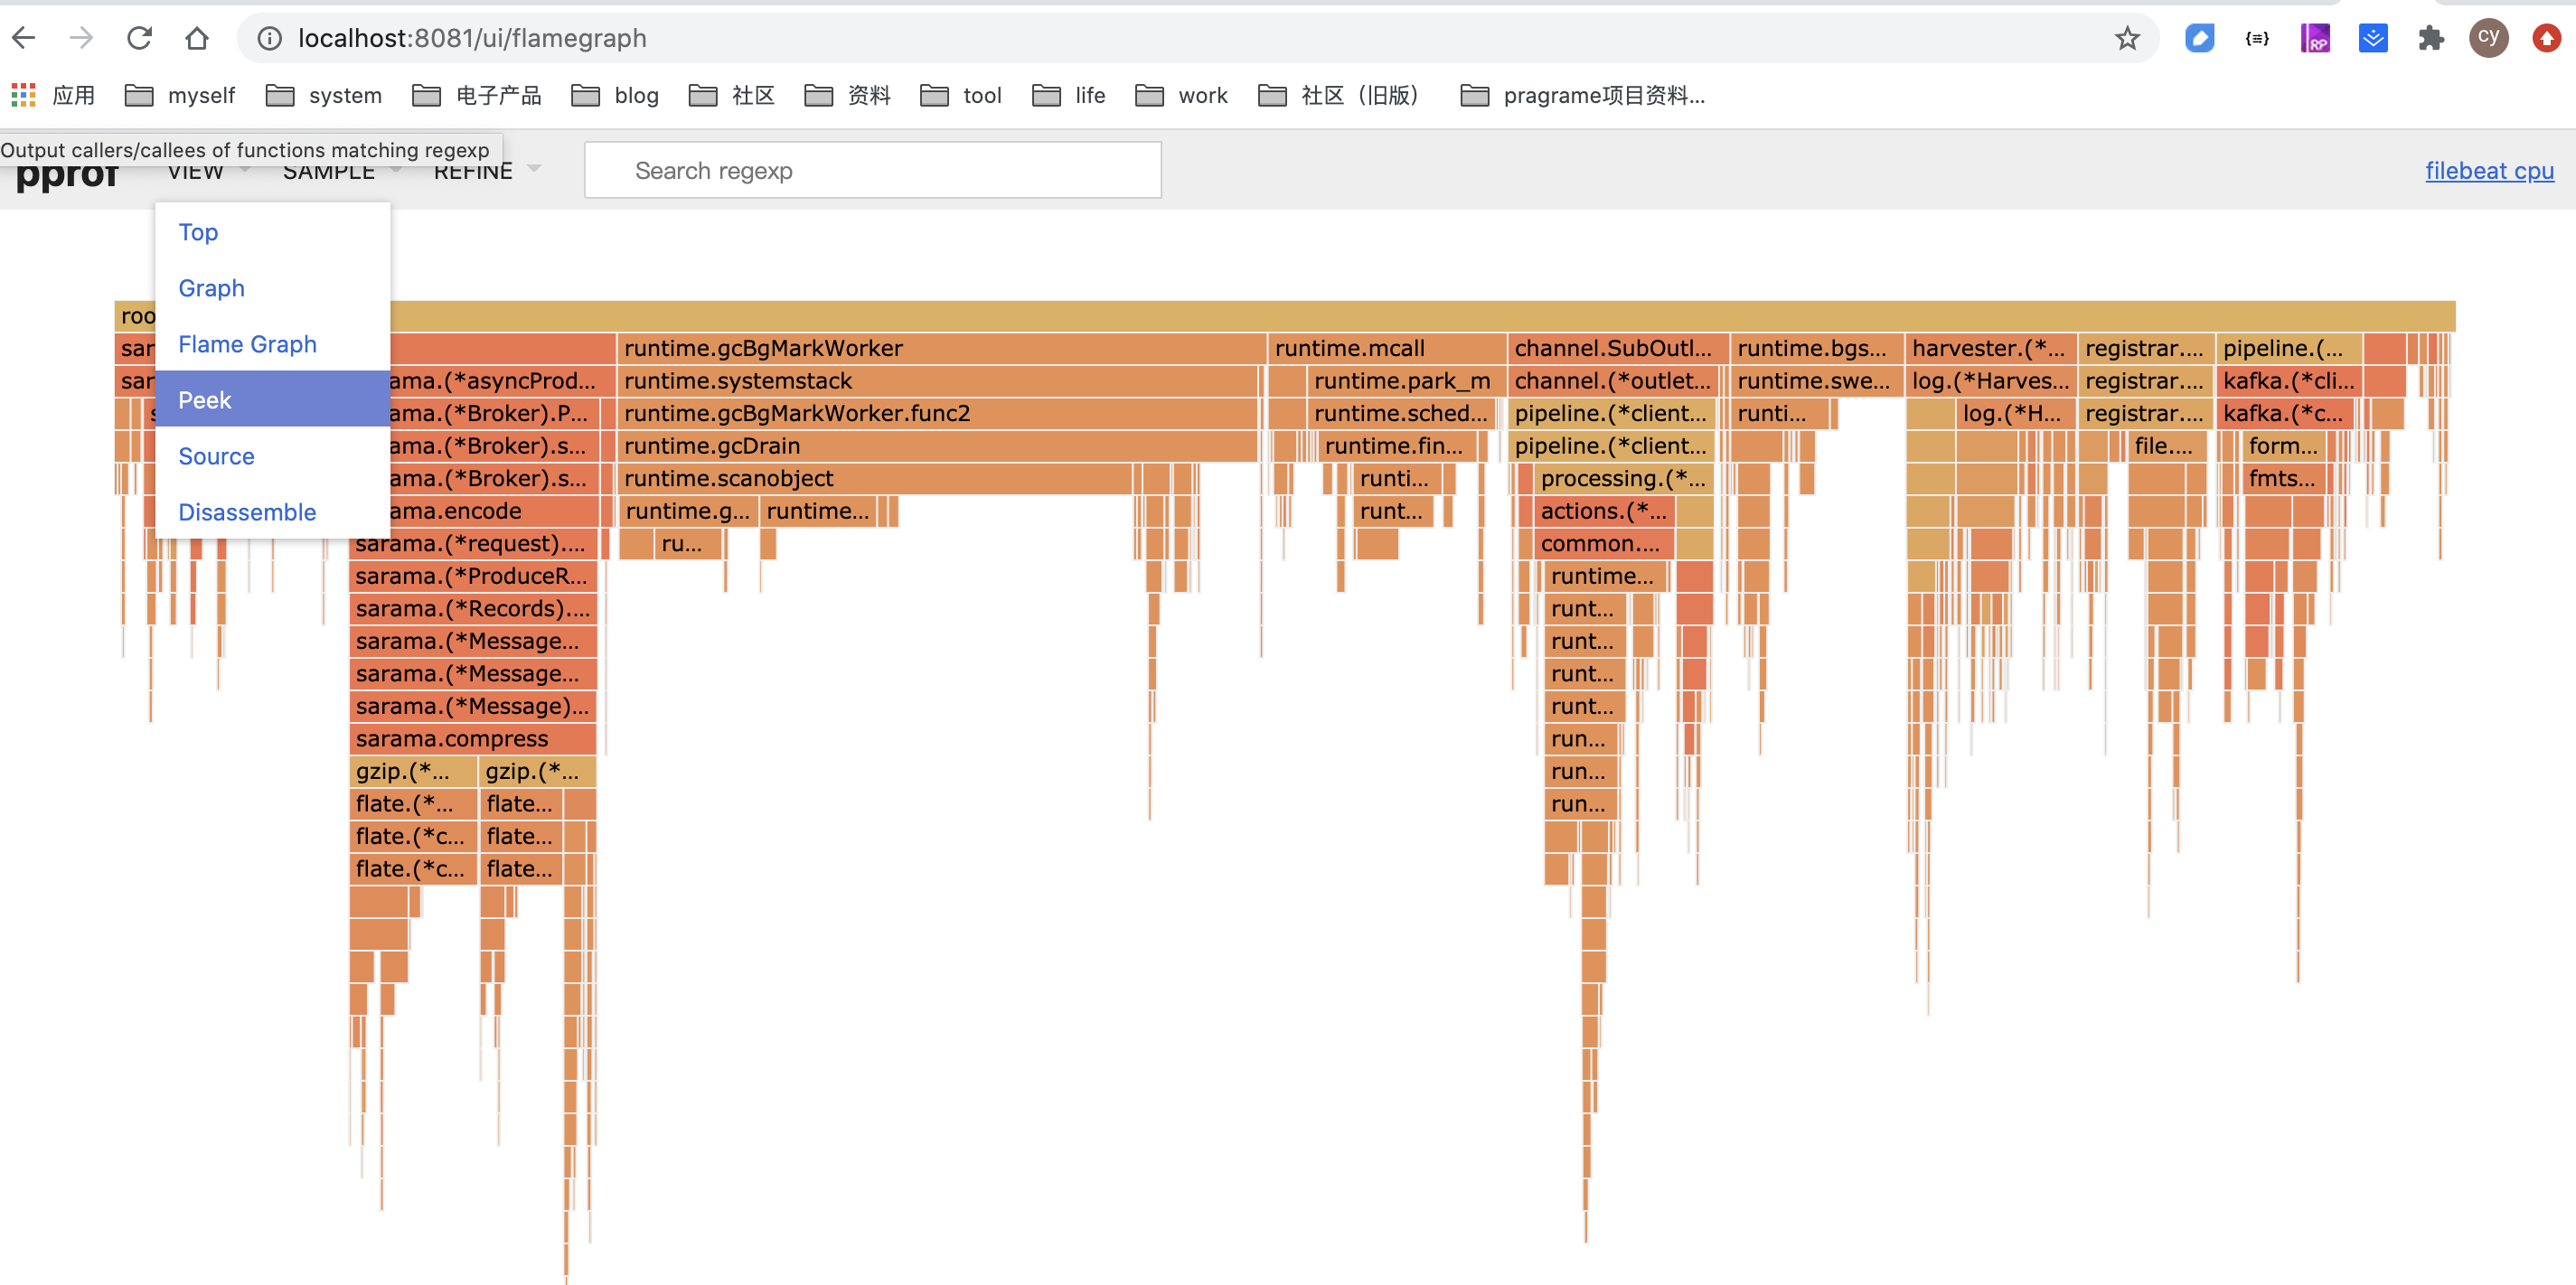
在使用火焰图的时候,也是需要使用交互的命令的,比如在list函数的时候,也可以看出每个函数的调用时间。
实战
获取问题程序
直接到github上下载
go get -d github.com/wolfogre/go-pprof-practice
cd $GOPATH/src/github.com/wolfogre/go-pprof-practice
简单看一下
package main

import (
    // 略
    _ "net/http/pprof" // 会自动注册 handler 到 http server,方便通过 http 接口获取程序运行采样报告
    // 略
)

func main() {
    // 略

    runtime.GOMAXPROCS(1) // 限制 CPU 使用数,避免过载
    runtime.SetMutexProfileFraction(1) // 开启对锁调用的跟踪
    runtime.SetBlockProfileRate(1) // 开启对阻塞操作的跟踪

    go func() {
        // 启动一个 http server,注意 pprof 相关的 handler 已经自动注册过了
        if err := http.ListenAndServe(":6060", nil); err != nil {
            log.Fatal(err)
        }
        os.Exit(0)
    }()

    // 略
}
编译运行
go build
./go-pprof-practice
使用pprof查看资源使用情况,这个在上面都详细说明过了。
http://localhost:6060/debug/pprof/
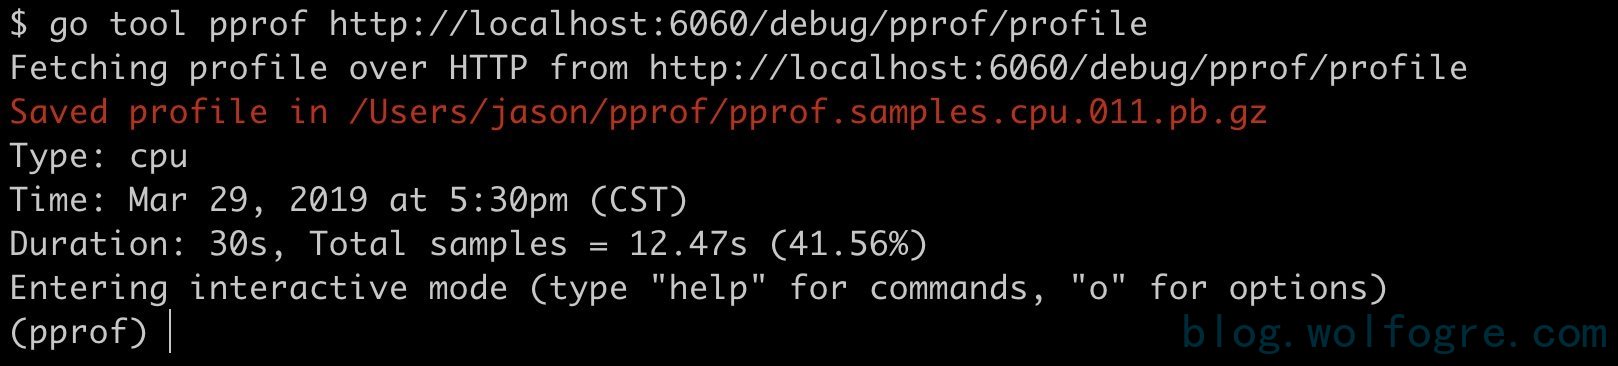
排查cpu占比过高
1、使用命令:go tool pprof http://localhost:6060/debug/pprof/profile ,等待一会儿后,进入一个交互式终端:
2、输入 top 命令,查看 CPU 占用较高的调用:
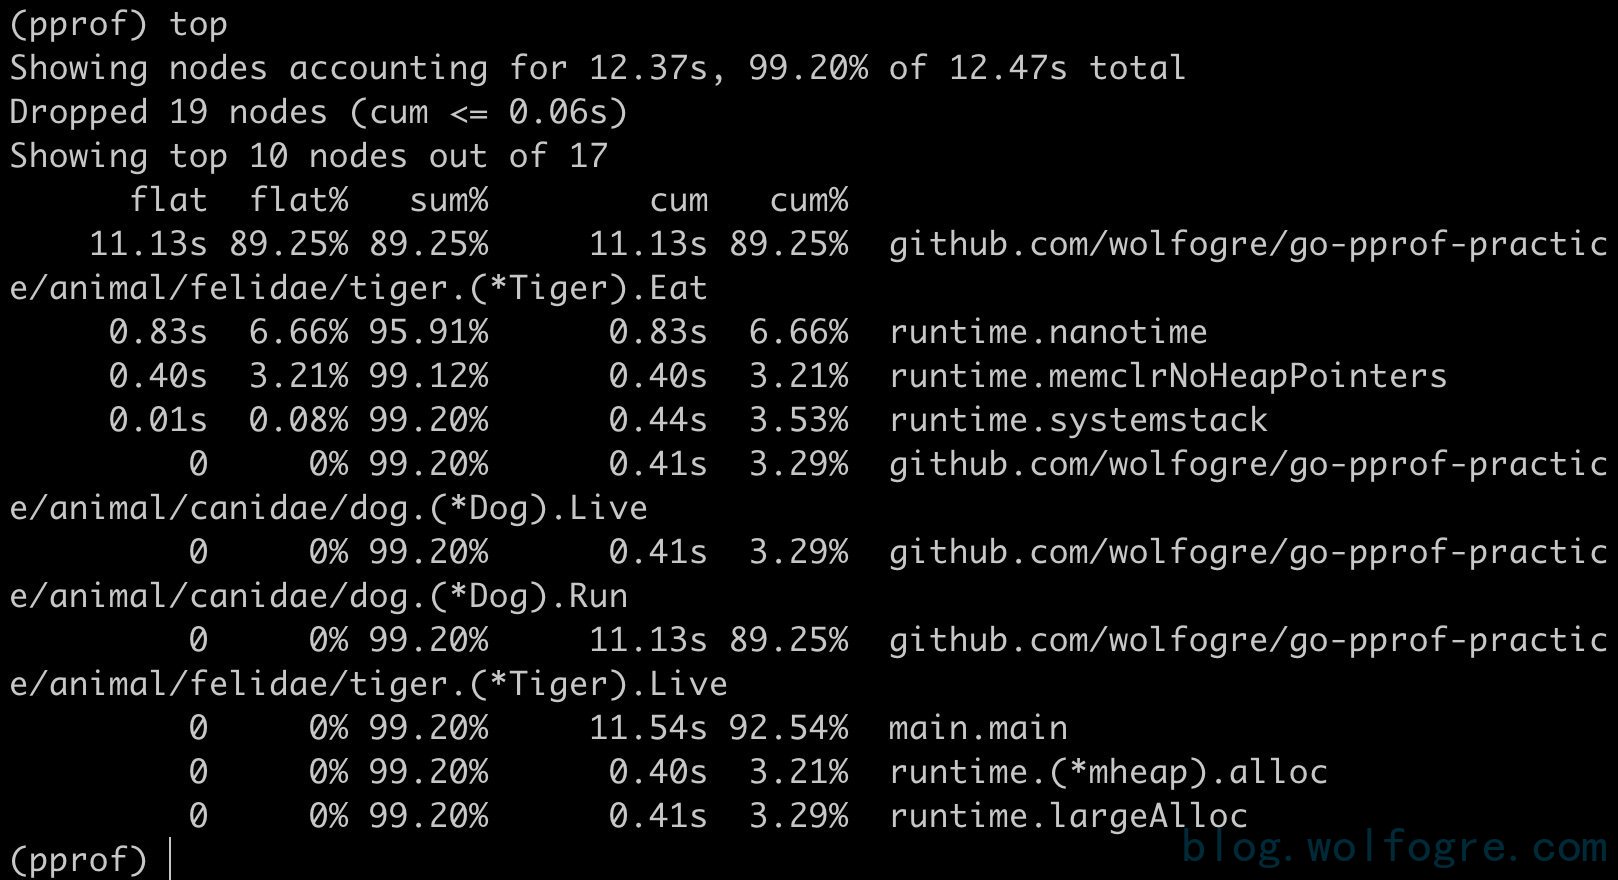
很明显,CPU 占用过高是 github.com/wolfogre/go-pprof-practice/animal/felidae/tiger.(*Tiger).Eat 造成的。
3、输入 list Eat,查看问题具体在代码的哪一个位置
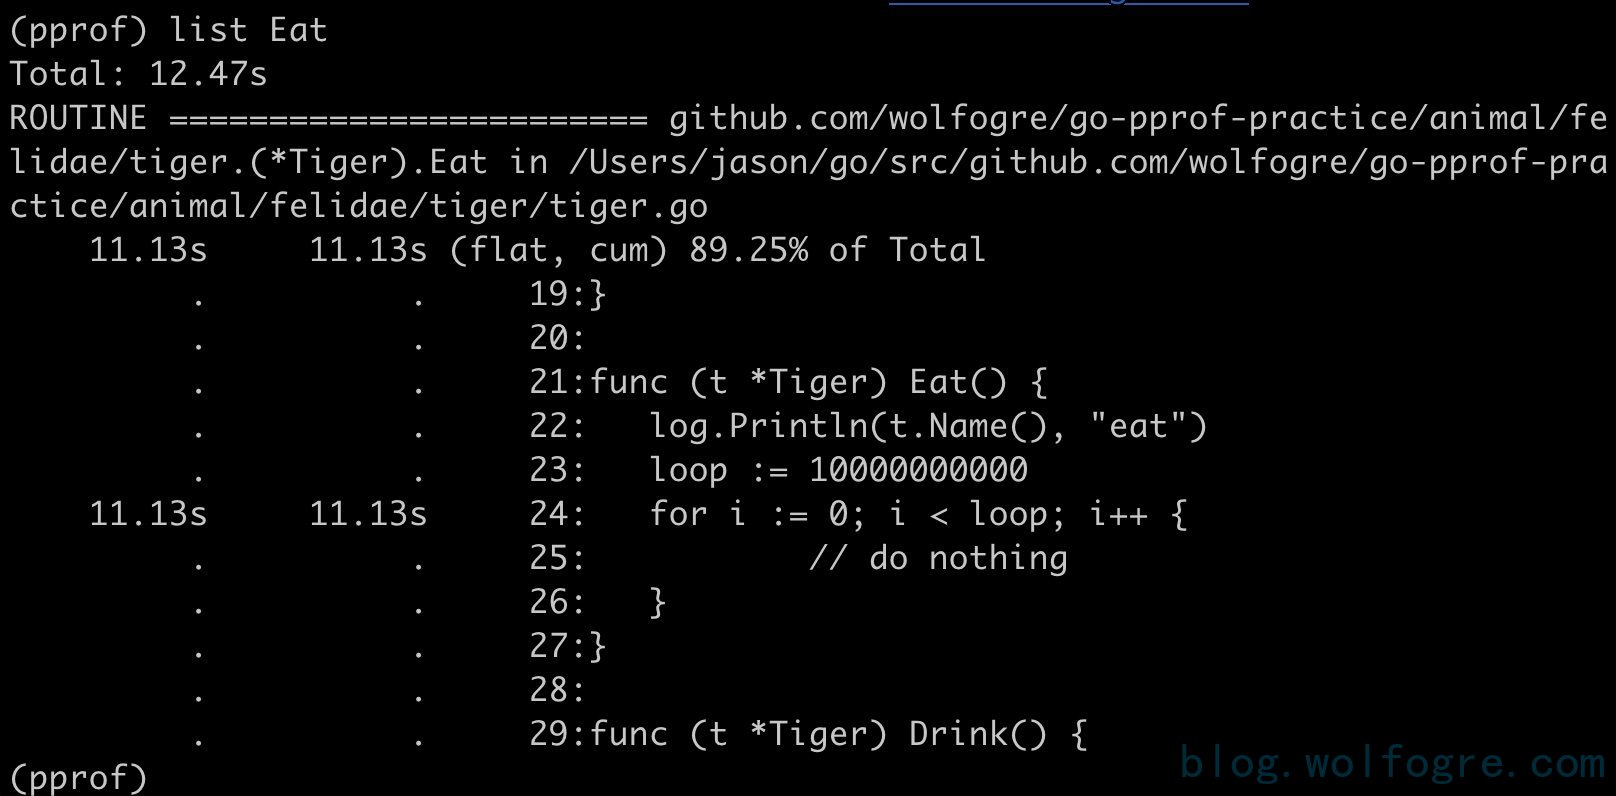
可以看到,是第 24 行那个一百亿次空循环占用了大量 CPU 时间,至此,问题定位成功!
4、我们还可以使用web来形象的查看

图中,tiger.(*Tiger).Eat 函数的框特别大,箭头特别粗,pprof 生怕你不知道这个函数的 CPU 占用很高,这张图还包含了很多有趣且有价值的信息。
排查内存占用过高
同样命令:go tool pprof http://localhost:6060/debug/pprof/heap, 然后再一次使用 top、list 来定问问题代码,就不多说了
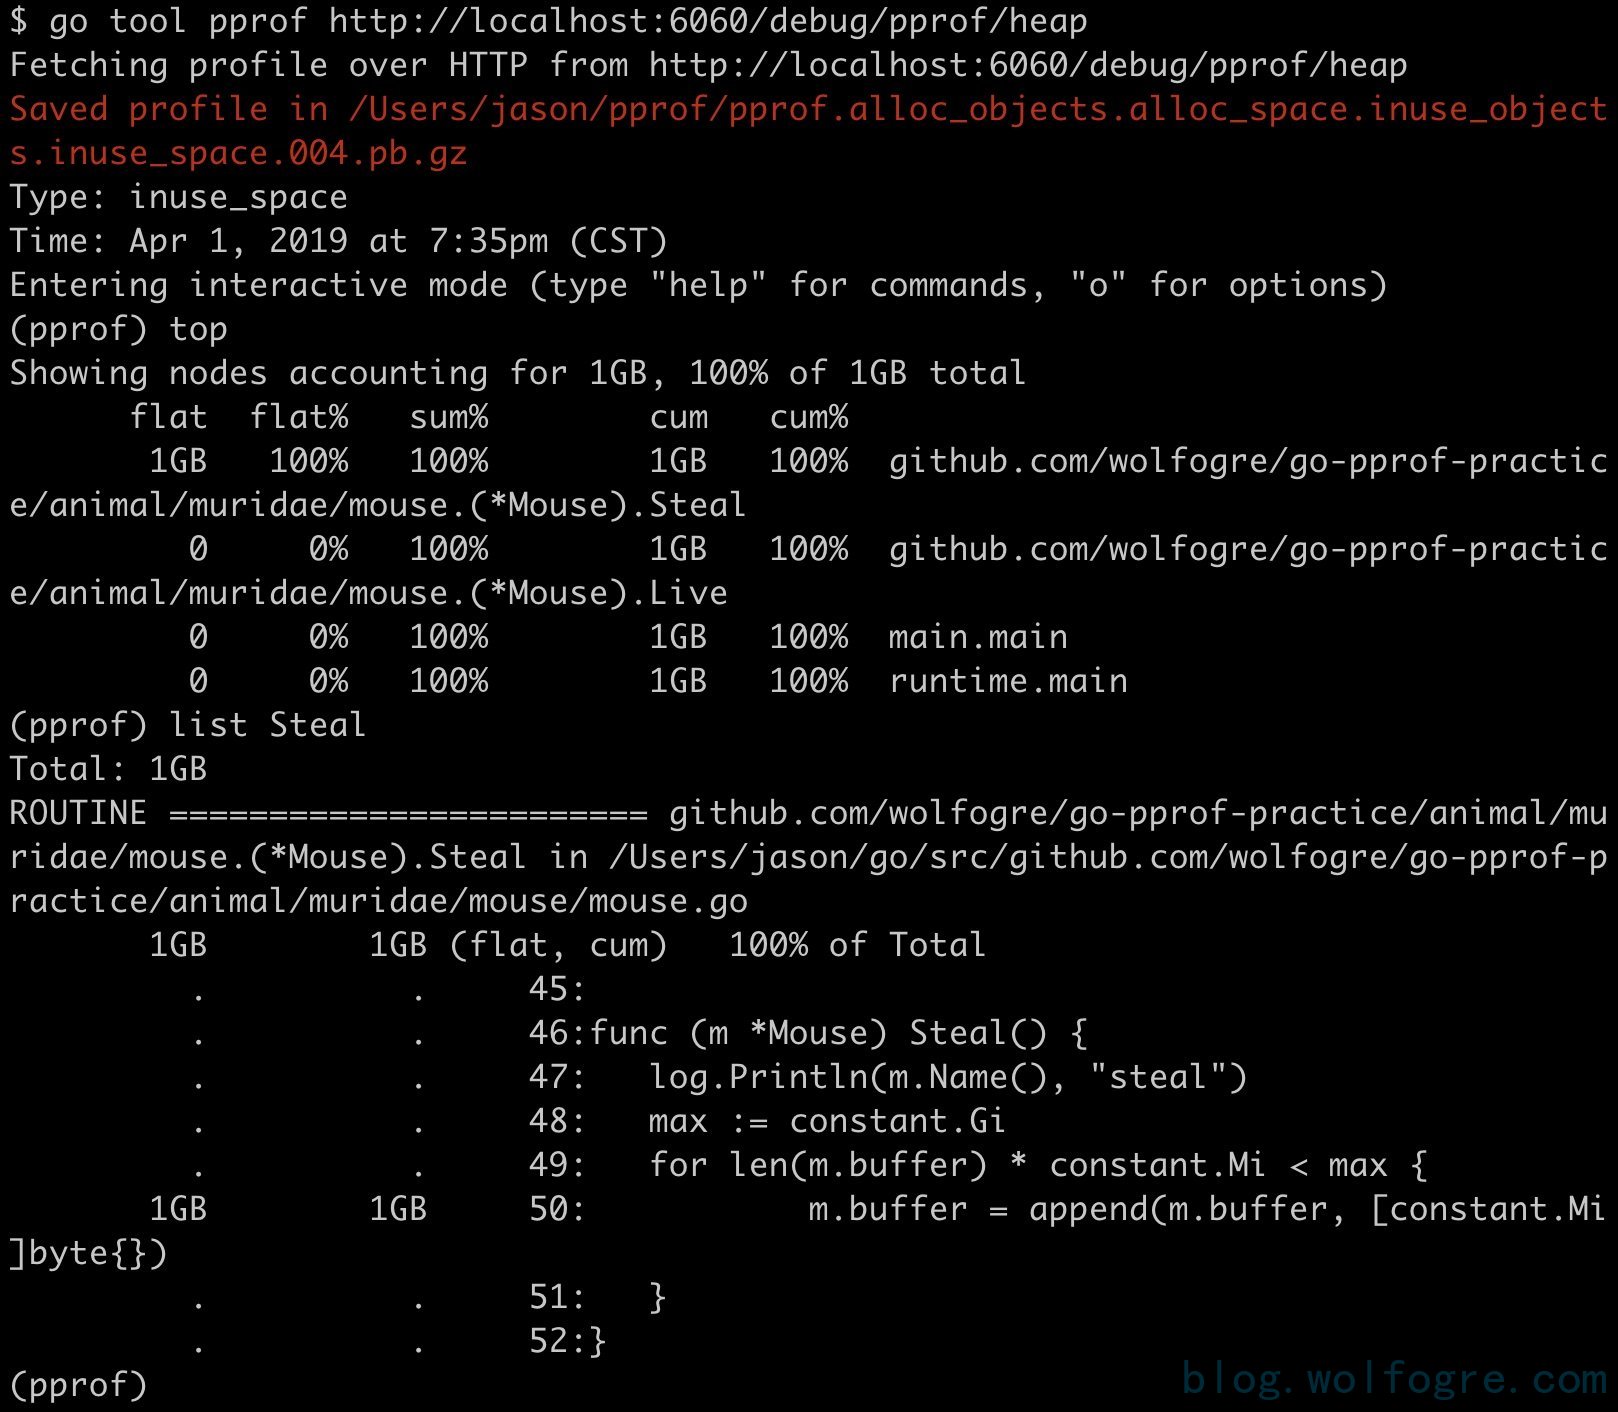
可以看到这次出问题的地方在 github.com/wolfogre/go-pprof-practice/animal/muridae/mouse.(*Mouse).Steal,可以看到,这里有个循环会一直向 m.buffer 里追加长度为 1 MiB 的数组,直到总容量到达 1 GiB 为止,且一直不释放这些内存,这就难怪会有这么高的内存占用了。
其他
其实排查其他的问题都是通过相同的方式进行排查,top,list,web来看出问题所在,当然使用火焰图就更加的形象了。